


wind + Sick + Hills + Dogs = Best ride of the year
 04-16-08, 01:06 PM
#1
Got Hills, I do!
Thread Starter
Join Date: Aug 2006
Location: Northern Michigan
Posts: 765
Bikes: Trek Domane SLR 9.9 - Trek Supercaliber 9.9.
Mentioned: 1 Post(s)
Tagged: 0 Thread(s)
Quoted: 4 Post(s)
Likes: 0
Liked 9 Times
in
8 Posts
wind + Sick + Hills + Dogs = Best ride of the year
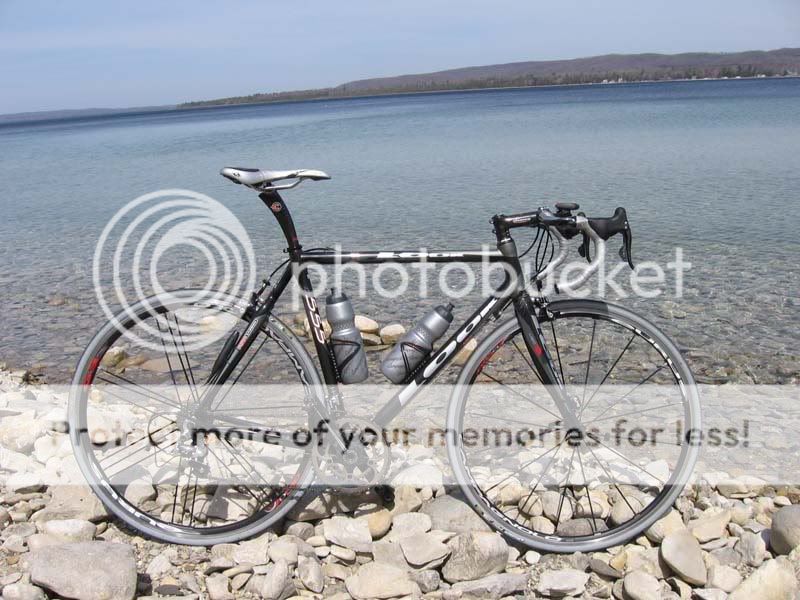
Yup it was windy as all hell, I was sick, hilly route, and man eating dogs, but over all it was the best ride of the year. It was over 70 when I got home and I have no complaints. Well maybe those darn dogs, they were out in full force today. most of them were no problem, but I did have two big Rottweiler's that put the fear of god in to me. They came out in the road and chased me down. If it were not for the tailwind I would have been lunch.
The wind was tough but fun at the same time. The way out was demoralizing, but the way home was fast and fun. I can tell you that going 25-30 MPH and having the wind hit your back is a very odd feeling, or even worse feeling no wind at all. At one point with the cross wind I was afraid that my pedal might hit (I was going straight).
Over all I got 66 miles in and even though I was a little sick it was a great ride. It is amazing what the warm sun compared to cold snow can do for a ride.
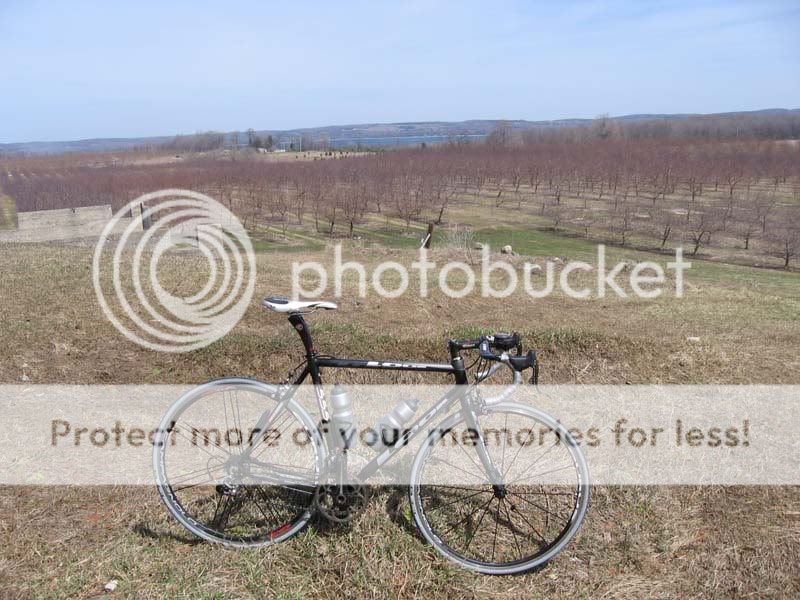
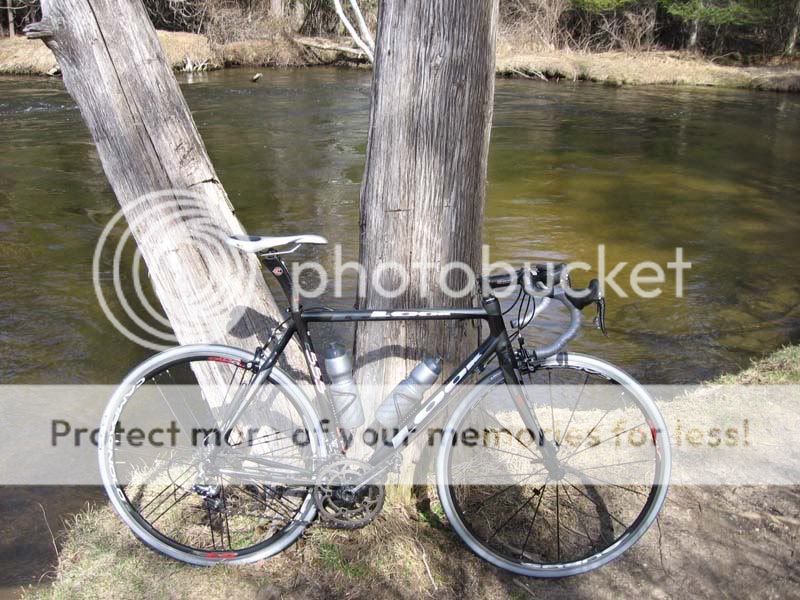
As long as I was felling a little sick I did stop and take some pictures. Even a self portrait to verify the flue and lower than normal stats and as you can see no arm warmers.


Here are the stats. My cadence and watts were down due to the cold.
Data Value Unit
Duration 4:03:05
Sampling Rate 5 s
Cycling Efficiency 18.4 %
Energy Expenditure 2808 kcal
Number of Heart Beats 36231 beats
Recovery - 14 beats
Minimum Heart Rate 89 bpm
Average Heart Rate 149 bpm
Maximum Heart Rate 182 bpm
Standard Deviation 11.6 bpm
Minimum Speed 1.2 mph
Average Speed 16.4 mph
Maximum Speed 43.4 mph
Distance 66.4 miles
Odometer 401 miles
Minimum Cadence 31 rpm
Average Cadence 83 rpm
Maximum Cadence 118 rpm
Minimum Altitude 548 ft
Average Altitude 728 ft
Maximum Altitude 1112 ft
Ascent 2979 ft
Descent 3045 ft
Slopes 8
VAM 735 ft/h
Minimum Power 1 Watts
Average Power 187 Watts
Maximum Power 951 Watts
Pedaling Index Average 15 %
Pedaling Index Maximum 51 %
Left Right Balance Average L49 - 51R Left - Right
Left Right Balance Maximum L83 - 17R Left - Right
Just realized this was a double post and was missing some of the information/pictures, so I fixed it.
The wind was tough but fun at the same time. The way out was demoralizing, but the way home was fast and fun. I can tell you that going 25-30 MPH and having the wind hit your back is a very odd feeling, or even worse feeling no wind at all. At one point with the cross wind I was afraid that my pedal might hit (I was going straight).
Over all I got 66 miles in and even though I was a little sick it was a great ride. It is amazing what the warm sun compared to cold snow can do for a ride.
As long as I was felling a little sick I did stop and take some pictures. Even a self portrait to verify the flue and lower than normal stats
and as you can see no arm warmers.Here are the stats. My cadence and watts were down due to the cold.
Data Value Unit
Duration 4:03:05
Sampling Rate 5 s
Cycling Efficiency 18.4 %
Energy Expenditure 2808 kcal
Number of Heart Beats 36231 beats
Recovery - 14 beats
Minimum Heart Rate 89 bpm
Average Heart Rate 149 bpm
Maximum Heart Rate 182 bpm
Standard Deviation 11.6 bpm
Minimum Speed 1.2 mph
Average Speed 16.4 mph
Maximum Speed 43.4 mph
Distance 66.4 miles
Odometer 401 miles
Minimum Cadence 31 rpm
Average Cadence 83 rpm
Maximum Cadence 118 rpm
Minimum Altitude 548 ft
Average Altitude 728 ft
Maximum Altitude 1112 ft
Ascent 2979 ft
Descent 3045 ft
Slopes 8
VAM 735 ft/h
Minimum Power 1 Watts
Average Power 187 Watts
Maximum Power 951 Watts
Pedaling Index Average 15 %
Pedaling Index Maximum 51 %
Left Right Balance Average L49 - 51R Left - Right
Left Right Balance Maximum L83 - 17R Left - Right
Just realized this was a double post and was missing some of the information/pictures, so I fixed it.
Last edited by "Fred"; 04-16-08 at 04:21 PM.
 04-16-08, 01:18 PM
#2
3 seconds

Join Date: Sep 2006
Location: Chicago, NW burbs
Posts: 2,935
Mentioned: 0 Post(s)
Tagged: 0 Thread(s)
Quoted: 0 Post(s)
Likes: 0
Liked 0 Times
in
0 Posts
Nice workout. The stats look like you got them from polar sofware. How?
[edit]
Found it, selection info.
Data Value Unit
Duration 1:26:01
Sampling Rate 1 s
Cycling Efficiency 19.5 %
Energy Expenditure 1160 kcal
Number of Heart Beats 12991 beats
Recovery -54 beats
Minimum Heart Rate 72 bpm
Average Heart Rate 151 bpm
Maximum Heart Rate 168 bpm
Standard Deviation 11.5 bpm
Minimum Speed 1.2 mph
Average Speed 17.2 mph
Maximum Speed 32.4 mph
Distance 24.6 miles
Odometer 94 miles
Minimum Cadence 34 rpm
Average Cadence 86 rpm
Maximum Cadence 115 rpm
Coasting Time 0:24:42 (28.7 %)
Coasting Distance 6.8 miles (27.8 %)
Minimum Altitude 659 ft
Average Altitude 755 ft
Maximum Altitude 840 ft
Ascent 1060 ft
Descent 1056 ft
VAM 739 ft/h
Minimum Power 1 Watts
Average Power 228 Watts
Average Power (0 W incl.) 161 Watts
Maximum Power 622 Watts
Pedaling Index Average 21 %
Pedaling Index Maximum 68 %
Left Right Balance Average L49 - 51R Left - Right
Left Right Balance Maximum L94 - 6R Left - Right
So what does this mean? Hmmm
04-16-08, 01:24 PM
#3

grilled cheesus
nice ride. and your bike is sick!!!! later.
__________________
04-16-08, 01:34 PM
#4
3 seconds
Join Date: Sep 2006
Location: Chicago, NW burbs
Posts: 2,935
Mentioned: 0 Post(s)
Tagged: 0 Thread(s)
Quoted: 0 Post(s)
Likes: 0
Liked 0 Times
in
0 Posts
Fred, what do things things mean?
recovery: you -14 beats, me -54?
Pedaling index: you 15%, me 21%
I'm going to start to interpret this stuff if I can.
recovery: you -14 beats, me -54?
Pedaling index: you 15%, me 21%
I'm going to start to interpret this stuff if I can.
04-16-08, 02:43 PM
#6
3 seconds
Join Date: Sep 2006
Location: Chicago, NW burbs
Posts: 2,935
Mentioned: 0 Post(s)
Tagged: 0 Thread(s)
Quoted: 0 Post(s)
Likes: 0
Liked 0 Times
in
0 Posts
OK, Here is what I am learning. You are more of a masher, I am more of a spinner. Your higher wattage, lower cadence, and lower pedaling index support this.
PI helps optimize pedaling technique by measuring the ‘roundness’ of force distribution, or how evenly the power is produced – the higher the PI percentage, the better. Values of 30% or more are very good. Breaks in continuous pedaling affect PI values adversely.
PI helps optimize pedaling technique by measuring the ‘roundness’ of force distribution, or how evenly the power is produced – the higher the PI percentage, the better. Values of 30% or more are very good. Breaks in continuous pedaling affect PI values adversely.
04-16-08, 02:45 PM
#7
3 seconds
Join Date: Sep 2006
Location: Chicago, NW burbs
Posts: 2,935
Mentioned: 0 Post(s)
Tagged: 0 Thread(s)
Quoted: 0 Post(s)
Likes: 0
Liked 0 Times
in
0 Posts
Polar Cycling Efficiency
Cycling Efficiency expresses energy expenditure converted into the power that propels the bike forward. In other words, cycling efficiency represents the efficacy of skeletal muscles to transform the body’s stored biochemical energy into mechanical movement, while the remainder of the energy is lost as heat. The higher the efficiency, the more power one can produce to ride the bike with the same amount of energy and oxygen. This is vital for success in cycling races and other long-distance events.
Cycling efficiency only used to be measured in laboratory conditions. Now measurements in the field are easily conducted using Polar products featuring the cycling efficiency function.
Cyclists’ gross efficiency values typically vary between 17% and 22%. Therefore, even small changes in efficiency can mean the difference between success and failure. Efficiency can be improved even after years of training whereas e.g. maximum aerobic capacity (VO2max) is usually achieved within a few months to two years of skillful training.
In general, factors such as body size, gender, fitness level and skill affect individual differences in efficiency. Pedaling technique and breaks in continuous pedaling also have an effect.
It makes more sense to compare your current values to your earlier ones, and not to the values of other cyclists. Cycling efficiency values are especially helpful when they are measured over a longer period of time.
So, it sounds like we can't accurately compare cycling efficiency, especially with your much longer ride.
04-16-08, 02:56 PM
#8
Got Hills, I do!
Thread Starter
Join Date: Aug 2006
Location: Northern Michigan
Posts: 765
Bikes: Trek Domane SLR 9.9 - Trek Supercaliber 9.9.
Mentioned: 1 Post(s)
Tagged: 0 Thread(s)
Quoted: 4 Post(s)
Likes: 0
Liked 9 Times
in
8 Posts
The Pedaling Index was another interesting feature designed to improve efficiency. It measures the Power output during the downward stroke, between the 1 and 5 o'clock positions. The higher the number, the more efficient you are at applying power over the positive stroke (downward). This will train you to maintain more consistency over the whole circular pedal stroke and develop a fluid motion.
04-16-08, 03:06 PM
#9
3 seconds
Join Date: Sep 2006
Location: Chicago, NW burbs
Posts: 2,935
Mentioned: 0 Post(s)
Tagged: 0 Thread(s)
Quoted: 0 Post(s)
Likes: 0
Liked 0 Times
in
0 Posts
I called Polar as well and they told me it was simply the difference between your heart rate at the beginning of the selection and at the end of the selection. They are really not very helpful/knowledgeable.
04-16-08, 03:23 PM
#11
3 seconds
Join Date: Sep 2006
Location: Chicago, NW burbs
Posts: 2,935
Mentioned: 0 Post(s)
Tagged: 0 Thread(s)
Quoted: 0 Post(s)
Likes: 0
Liked 0 Times
in
0 Posts
I took another data set before I hurt my knee (last November).
Data Value Unit
Duration 2:32:25
Sampling Rate 5 s
Energy Expenditure 1690 kcal
Number of Heart Beats 22722 beats
Recovery -47 beats
Minimum Heart Rate 87 bpm
Average Heart Rate 149 bpm
Maximum Heart Rate 175 bpm
Standard Deviation 13.8 bpm
Minimum Speed 2.3 mph
Average Speed 19.9 mph
Maximum Speed 32.5 mph
Distance 48.6 miles
Odometer 2525 miles
Minimum Cadence 30 rpm
Average Cadence 97 rpm
Maximum Cadence 119 rpm
Coasting Time 0:25:55 (17.0 %)
Coasting Distance 6.1 miles (12.5 %)
Minimum Altitude 0 ft
Average Altitude 1057 ft
Maximum Altitude 1210 ft
Ascent 942 ft
Descent 865 ft
Slopes 2
Grade % 0.4 %
VAM 371 ft/h
Minimum Power 1 Watts
Average Power 220 Watts
Average Power (0 W incl.) 171 Watts
Maximum Power 758 Watts
Pedaling Index Average 26 %
Pedaling Index Maximum 65 %
Left Right Balance Average L50 - 50R Left - Right
Left Right Balance Maximum L82 - 18R Left - Right
04-16-08, 03:26 PM
#12
3 seconds
Join Date: Sep 2006
Location: Chicago, NW burbs
Posts: 2,935
Mentioned: 0 Post(s)
Tagged: 0 Thread(s)
Quoted: 0 Post(s)
Likes: 0
Liked 0 Times
in
0 Posts
My pedaling efficiency has dropped ... I think I still need some work on my stroke as I work toward full recovery.
04-16-08, 04:13 PM
#13
Got Hills, I do!
Thread Starter
Join Date: Aug 2006
Location: Northern Michigan
Posts: 765
Bikes: Trek Domane SLR 9.9 - Trek Supercaliber 9.9.
Mentioned: 1 Post(s)
Tagged: 0 Thread(s)
Quoted: 4 Post(s)
Likes: 0
Liked 9 Times
in
8 Posts
I have the CS600. I got it last fall and am just now starting to understand all the data. I am still curios about the recovery beats and the guy at polar told me it had something to do with the differance between two rides. You would think tech support would know how these things work.


