I think it's because the power varies a lot from second-to-second, and also because it's compressing the whole ride into a fairly narrow chart.
Here's an example of my ride from a couple of years ago, with the charts from the free Golden Cheetah analysis software.
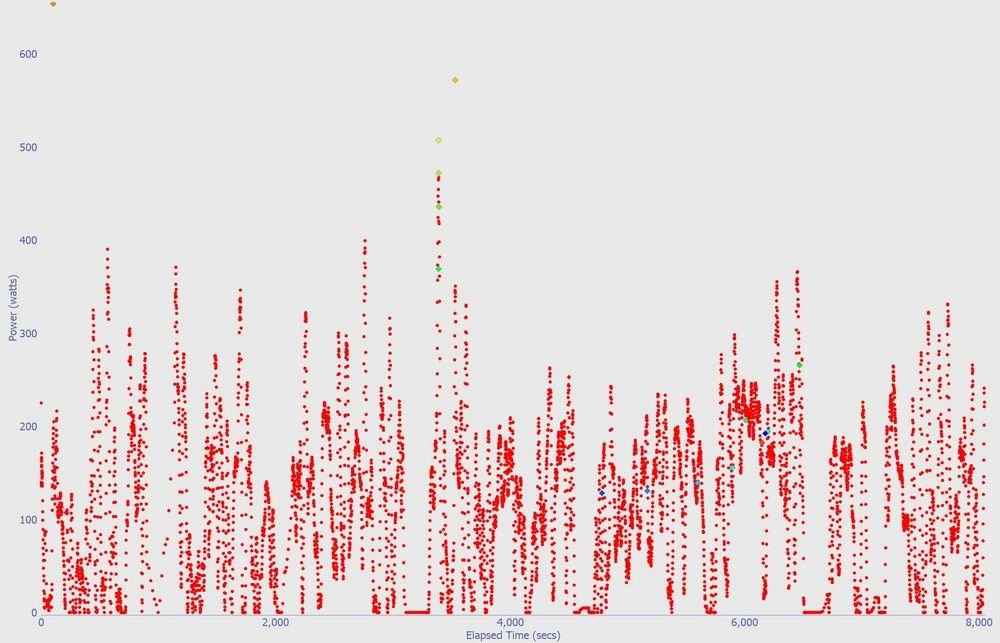
2 hours recorded, 28.5 miles. My Garmin records once per second. A few hard efforts on the hill climbs during the ride.
~~~
The power data with 3 second smoothing. That averages each second using 3 consecutive second's power readings. This smooths out the data slightly.
The big swings in power numbers from second to second was a big surprise to me when my power meter was new. That's why Garmins display 3 second or 30 second averaging, depending on what you want to use the number for.

~~
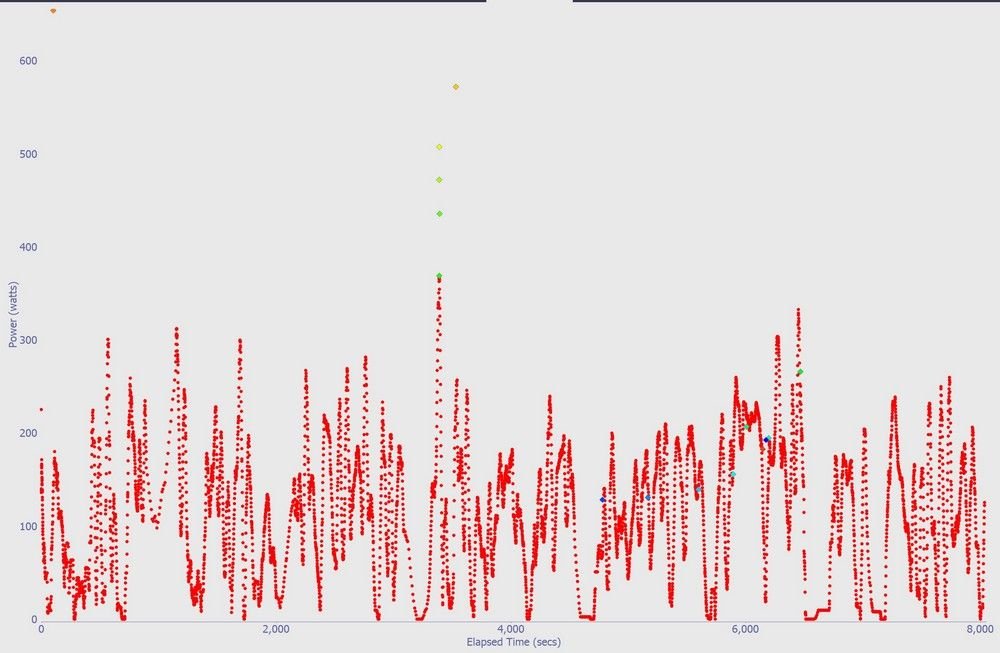
15 second smoothing. The same chart using 15 seconds.
Now it's starting to be a line instead of a scatter plot as the shorter extremes are averaged with adjacent data.
~~~
30 second averaging. This is starting to look like Strava's chart.
~~~~~~~~~~
So, those short duration peak power readings get averaged down by the lower power a few seconds away.
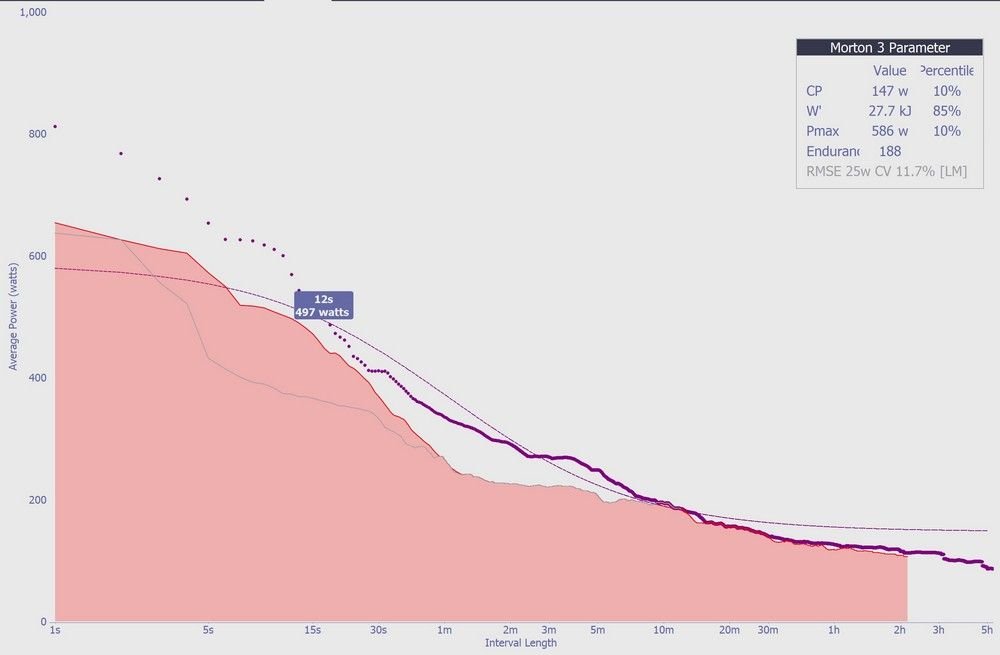
A more interesting way to view the power data is by Golden Cheetah's CP Chart. "Critical Power", where it scans the whole ride and picks out the best power numbers for 1 second, 2 seconds, etc duration.
Strava has a similar chart in the Analysis section, "Power Curve".
Golden Cheetah is more detailed -- for instance, it can show the power for an interval or a hill climb within this CP chart, and can compare the current ride to maximum numbers from a selected range of dates.
It's good for questions like: How much power can I do for 30 seconds? 3 minutes? 20 minutes? Great for pacing climbs and fast flat rides too.
The dark purple line and dots are my 12-month maximums collected from all the rides. (The light, smooth line is a theoretical estimate of possible max power.)
The shaded area is the current ride.
I hovered over the 12 second mark and it popped up the 12-second power number.
I can see that I matched or set the best power numbers in the 10-minute range on this ride. It was a long, steady climb, and I was watching the power for pacing there.
~~~~
The same ride in Strava. It's the same curve, but the x-axis is scaled differently.
