


Bikeforums.net Resource Utilization
 08-08-19, 04:13 PM
#1
Senior Member
Thread Starter
Join Date: Jan 2011
Location: Pinehurst, NC, US
Posts: 1,716
Bikes: 2020 Trek Emonda SL6, 90's Vintage EL-OS Steel Bianchi with 2014 Campy Chorus Upgrade
Mentioned: 5 Post(s)
Tagged: 0 Thread(s)
Quoted: 452 Post(s)
Liked 162 Times
in
110 Posts
Bikeforums.net Resource Utilization
There is not administrative and/or technical support area that I can find, so I just picked one of the most active forums for lack of a better choice.
I have a problem when browsing this forum when using a current/updated version of Windows 10. This has been going on for a while (4 to 8 months maybe), although before recently I just viewed it as a general Chrome issue. When I ran into similar issues with Firefox, I did more investigative work and isolated things down to this website.
When I open a bikeforums.net thread, often (maybe 70% of the time) if I just let it sit there for maybe 15 minutes to an hour or more while I do something else, memory usage just goes through the roof. I have seen the Chrome (and Firefox which is even worse) process (viewed in Windows Task Manager) grow to over 5G when bikeforums.net is the only tab open (my system tends to becomes unusable at this point). Edge seems to be somewhat less prone to this memory issue, but CPU utilization becomes a huge problem with Edge. Interestingly, Opera does not have this issue in my experience.
How many others have this problem? If you have it you will know that you have a problem, but probably not know where it comes from without a bit of looking. I am assuming here that you will keep a given thread open for a half hour or more on occasion.
Thanks.
dave
ps. I asked my brother to do an experiment where he opened only a single (20 some response) bikeforums.net thread. He is a pretty techie guy and this is his response back to me and it is pretty geeky stuff. I am techie enough to mostly know what he is saying, but not techie enough to have done the work. In a nutshell he is seeing the same problem and seeing some internal behavior that seem strange in his experience. And his experienced memory usage growth rate (1.3G/hour) is quite low compared to my typical experience. And yes, I am writing this using Opera.
I stopped all my Chrome processes and brought up task manager and brought up an auto screen capture program that I setup to take a snapshot every hour of Task Manager and I was planning on letting it run overnight to see what happened (how much memory got used on each hour overnight). But after 2 hours I went to check and it was already taking up 1.3 Gig/Hour. So I ran to Best Buy to go get 20 Gig of more memory so it would run overnight but they didn't have any memory so I stopped the process :-) .
I ran Process Explorer to see what the Chrome process is doing. Normally when I do this is see a ton of stuff (like 20 events/sec) and I have to filter out the uninteresting things. Normally you see just tons and tons of registry entry accesses that have to be filtered out to see what interesting things it is doing. Then you can see what files it's accessing and what IP traffic there is (where it is sending/receiving information with, can't see the data). And you filter on from there to see what you are interested in.
But this one Chrome process isn't doing any of that at all. I filtered nothing and see very little stuff. All it seems to do is over and over about every 30 seconds or so is, create 6 threads, Query an Windows DLL (ntdll.dll) and then Query some Chrome dll (something like Chrome_Child.dll or something). And then the 6 threads that were created then exit. This doesn't all do this at once, but a few seconds apart ending with like 10 seconds of quite time and repeats. No Registry accesses, no file accesses (other than Querying the dlls and the threads being created and exiting) and no network activity at all. But the process just grows and grows in the memory allocations (which process explorer is not able to show memory being allocated that I have ever seen, just have to see that with Task Manager).
Really rare (as in never) to see that lack of registry access. You wouldn't believe how much registry access you normally get. Even in processes I have written myself and I am accessing no registry at all, but the underlying O/S accesses the registry over and over for things I have no idea why (always a major pain to deal with when using Process Explorer).
Very strange on what this Chrome process is doing.
And then even more strange, when I was writing the above I had cleared the Process Explorer screen and so I started it up again so I could see the exact name of the DLLs being queried and exactly how often these threads are getting created and exiting and now I see none of that. I see nothing at all except for one thread exit. I don't know if I have to wait an hour or what. Or maybe I have Process Explorer's filter wrong or something (I have to filter on the processID of the chrome process) but it seems correct (it's been years since I have done this, so kind of rusty).
So really have no idea what is going on.
Now there are many sites I go to and see Chrome eat up memory, but nothing at the rate that URL does.
As far as Opera, I am going to guess that whatever that Web SIte is doing Opera probably doesn't support and you don't see the problem.
I can't figure out why I am no longer seeing events for that growing Chrome process from Process Monitor (before I said Process Explorer, but I just realized I am using an older version called Process Monitor). I am seeing 0 events. I pick another process ID and I see tons of stuff like normal. I am absolutely positive before I had the correct processID for that growing Chrome process, but now I am beginning to wonder. Anyway in either case it's doing next to nothing or completely nothing.
Geez, now I am getting the thread creating and exiting. And it is chrome_child.dll and ntdll.dll being queried. But this time it only created 3 threads and they exited. But it only did it once. I have been sitting here for 5 minutes and nothing else has happened. And FYI the Chrome that is on the URL is just sitting in the background. I haven't touched it all. A couple of times I have started the whole thing over (didn't reboot, takes too long) and therefore bring up a new Chrome to view the URL but every time I have just let it go to the background behind this email or whatever. Haven't touched it. Oh well, at least I have seen it do it once again anyway (although just creating 3 threads and not 6).
Geez, finally after 8 minutes it did it again. This time creating 4 threads. Before it was more like every 30 seconds it would do this and create 6 threads. Probably if I let it run for a couple of hours it might do it every 30 seconds maybe.
This is strange stuff.
 08-08-19, 04:21 PM
#2
~>~
Did you miss an entire sub-forum?
Forum Suggestions & User Assistance:
https://www.bikeforums.net/forum-sug...er-assistance/
Forum Suggestions & User Assistance:
https://www.bikeforums.net/forum-sug...er-assistance/
08-08-19, 04:29 PM
#3

Forum Moderator

Join Date: Jul 2007
Location: Kalamazoo MI
Posts: 20,635
Bikes: Fuji SL2.1 Carbon Di2 Cannondale Synapse Alloy 4 Trek Checkpoint ALR-5 Viscount Aerospace Pro Colnago Classic Rabobank Schwinn Waterford PMount Raleigh C50 Cromoly Hybrid Legnano Tipo Roma Pista
Mentioned: 58 Post(s)
Tagged: 0 Thread(s)
Quoted: 3085 Post(s)
Liked 6,568 Times
in
3,766 Posts
Thread moved from Road Cycling to User Assistance.
08-08-19, 04:33 PM
#4
Senior Member
Thread Starter
Join Date: Jan 2011
Location: Pinehurst, NC, US
Posts: 1,716
Bikes: 2020 Trek Emonda SL6, 90's Vintage EL-OS Steel Bianchi with 2014 Campy Chorus Upgrade
Mentioned: 5 Post(s)
Tagged: 0 Thread(s)
Quoted: 452 Post(s)
Liked 162 Times
in
110 Posts
Did you miss an entire sub-forum?
Forum Suggestions & User Assistance:
https://www.bikeforums.net/forum-sug...er-assistance/
Forum Suggestions & User Assistance:
https://www.bikeforums.net/forum-sug...er-assistance/
dave
08-08-19, 04:56 PM
#5
Senior Member

Join Date: Oct 2015
Location: San Diego, California
Posts: 4,077
Bikes: Velo Orange Piolet
Mentioned: 28 Post(s)
Tagged: 0 Thread(s)
Quoted: 2228 Post(s)
Liked 2,011 Times
in
972 Posts
You might try turning off javascript.
bikeforums.net works fine for me without javascript.
bikeforums.net works fine for me without javascript.
Likes For tyrion:
08-08-19, 05:28 PM
#7
Senior Member
Join Date: Feb 2016
Location: SE Wisconsin
Posts: 1,851
Bikes: Lemond '01 Maillot Jaune, Lemond '02 Victoire, Lemond '03 Poprad, Lemond '03 Wayzata DB conv(Poprad), '79 AcerMex Windsor Carrera Professional(pur new), '88 GT Tequesta(pur new), '01 Bianchi Grizzly, 1993 Trek 970 DB conv, Trek 8900 DB conv
Mentioned: 12 Post(s)
Tagged: 0 Thread(s)
Quoted: 759 Post(s)
Likes: 0
Liked 809 Times
in
471 Posts
Running Win 10 (ver. 1903) on three machines and use Chrome exclusively..no issues with this site.
08-08-19, 08:15 PM
#9
Senior Member
Join Date: Feb 2016
Location: SE Wisconsin
Posts: 1,851
Bikes: Lemond '01 Maillot Jaune, Lemond '02 Victoire, Lemond '03 Poprad, Lemond '03 Wayzata DB conv(Poprad), '79 AcerMex Windsor Carrera Professional(pur new), '88 GT Tequesta(pur new), '01 Bianchi Grizzly, 1993 Trek 970 DB conv, Trek 8900 DB conv
Mentioned: 12 Post(s)
Tagged: 0 Thread(s)
Quoted: 759 Post(s)
Likes: 0
Liked 809 Times
in
471 Posts
I run Chrome as installed. It has some instance of JS installed as part of the browser, there's not a separate JS installation. I've never had to make any adjustments to Chrome to get this site to run.
08-09-19, 12:41 PM
#10
Senior Member

I, too, have this problem with my Google Chrome at work all day (yes,I surf bikeforums all day at work!)
I have turned off javascript. We'll see how she goes.
I have turned off javascript. We'll see how she goes.
08-14-19, 07:49 PM
#11
Senior Member
Thread Starter
Join Date: Jan 2011
Location: Pinehurst, NC, US
Posts: 1,716
Bikes: 2020 Trek Emonda SL6, 90's Vintage EL-OS Steel Bianchi with 2014 Campy Chorus Upgrade
Mentioned: 5 Post(s)
Tagged: 0 Thread(s)
Quoted: 452 Post(s)
Liked 162 Times
in
110 Posts
For the record, I have found on thing on this site that requires Javascript. And that is that little notification bell widgetey thing in the uppder LH corner that lists your quotes, etc.
dave
dave
08-18-19, 04:38 PM
#12


What happened?

Join Date: Jun 2007
Location: Around here somewhere
Posts: 7,927
Bikes: 3 Rollfasts, 3 Schwinns, a Shelby and a Higgins Flightliner in a pear tree!
Mentioned: 57 Post(s)
Tagged: 1 Thread(s)
Quoted: 1835 Post(s)
Liked 292 Times
in
255 Posts
I use Firefox and even bad old Internet Explorer doesn't have this problem. Can you post a screenshot of the error?
__________________
I don't know nothing, and I memorized it in school and got this here paper I'm proud of to show it.
08-18-19, 05:41 PM
#13
Senior Member
Thread Starter
Join Date: Jan 2011
Location: Pinehurst, NC, US
Posts: 1,716
Bikes: 2020 Trek Emonda SL6, 90's Vintage EL-OS Steel Bianchi with 2014 Campy Chorus Upgrade
Mentioned: 5 Post(s)
Tagged: 0 Thread(s)
Quoted: 452 Post(s)
Liked 162 Times
in
110 Posts
Then I closed and reopened Firefox and opened a different forum (golf related) in this case, letting Firefox just sit on a single thread like before for about 5 minutes.

There is the issue. I am not the only one with that issue, but MANY others do not experience it. Right now I normally run Chrome with Javascript DISABLED, and no longer have the problem.
dave
08-18-19, 06:09 PM
#14
Senior Member
Thread Starter
Join Date: Jan 2011
Location: Pinehurst, NC, US
Posts: 1,716
Bikes: 2020 Trek Emonda SL6, 90's Vintage EL-OS Steel Bianchi with 2014 Campy Chorus Upgrade
Mentioned: 5 Post(s)
Tagged: 0 Thread(s)
Quoted: 452 Post(s)
Liked 162 Times
in
110 Posts
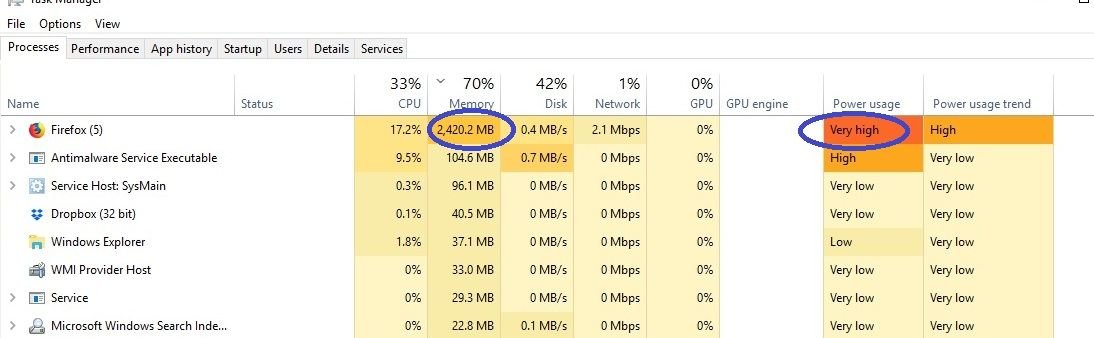
And just for grins I repeated this while looking ONLY at this thread using Chrome. The first image is with Javascript DISABLED and the 2nd with Javascript ENABLED. dave
08-18-19, 07:12 PM
#15
What happened?
Join Date: Jun 2007
Location: Around here somewhere
Posts: 7,927
Bikes: 3 Rollfasts, 3 Schwinns, a Shelby and a Higgins Flightliner in a pear tree!
Mentioned: 57 Post(s)
Tagged: 1 Thread(s)
Quoted: 1835 Post(s)
Liked 292 Times
in
255 Posts
I did a Firefox experiment (Javascript is enabled). First I opened a single thread on here Bikeforums and just let it sit for about 5 minutes. Nothing else running on Firefox. Here is the Taskmanager Processes view. Note the REALLY high memory utilization (which would grow if I waited longer). CPU is high as well, but this is quite variable.
Then I closed and reopened Firefox and opened a different forum (golf related) in this case, letting Firefox just sit on a single thread like before for about 5 minutes.
There is the issue. I am not the only one with that issue, but MANY others do not experience it. Right now I normally run Chrome with Javascript DISABLED, and no longer have the problem.
dave
Firefox has always been a memory hog, long before Quantum. The low figure of 424 MB is actually quite good.
By the way, if you haven't already please update. FF is up to 66.0.2 and perhaps still a modified 66.0.1 in Linux Mint. I didn't check for sure, and there were several upgrades/updates when I upgraded to 19.2 "Tina". And if you are using Mint, please don't forget to run Timeshift regularly and save a snapshot for recovery should something go terribly wrong, so now you can recover without reinstalling. A few updates into the new Mint is one that will probably require rebooting as it replaces the kernal. Get through that and it's dandy!
PS I hate Chrome

__________________
I don't know nothing, and I memorized it in school and got this here paper I'm proud of to show it.
08-18-19, 07:17 PM
#16
Senior Member
Thread Starter
Join Date: Jan 2011
Location: Pinehurst, NC, US
Posts: 1,716
Bikes: 2020 Trek Emonda SL6, 90's Vintage EL-OS Steel Bianchi with 2014 Campy Chorus Upgrade
Mentioned: 5 Post(s)
Tagged: 0 Thread(s)
Quoted: 452 Post(s)
Liked 162 Times
in
110 Posts
You do realize that in that listing Firefox is running FIVE instances, as Quantum is wont to do, at least in older versions. make sure that you are using the latest version you can and see if you can tweak the E10 settings. It may crash more often, the multiple instances are there for speed. You may find more than 5 instances running at one, even with one page open.
Firefox has always been a memory hog, long before Quantum. The low figure of 424 MB is actually quite good.
By the way, if you haven't already please update. FF is up to 66.0.2 and perhaps still a modified 66.0.1 in Linux Mint. I didn't check for sure, and there were several upgrades/updates when I upgraded to 19.2 "Tina". And if you are using Mint, please don't forget to run Timeshift regularly and save a snapshot for recovery should something go terribly wrong, so now you can recover without reinstalling. A few updates into the new Mint is one that will probably require rebooting as it replaces the kernal. Get through that and it's dandy!
PS I hate Chrome
dave
08-18-19, 09:40 PM
#17
What happened?
Join Date: Jun 2007
Location: Around here somewhere
Posts: 7,927
Bikes: 3 Rollfasts, 3 Schwinns, a Shelby and a Higgins Flightliner in a pear tree!
Mentioned: 57 Post(s)
Tagged: 1 Thread(s)
Quoted: 1835 Post(s)
Liked 292 Times
in
255 Posts
Yeah, my bad, my Delorean's flux capacitor needs repair. 
__________________
I don't know nothing, and I memorized it in school and got this here paper I'm proud of to show it.
