I upload a few gps tracks to ridewithgps.com. I've been trying out strava.com too. Both have a lot of interesting statistics available.
I load all my rides into
My Tourbook, free software that's installed on my PC. It can show detailed graphs and maps of each ride, and monthly and yearly statistics. It's fairly complicated, so it took a while to learn the different features. Now I have it set the way I like it.
My standard display. Recent rides are listed at top left, with monthly and yearly totals for miles,total elevation, hours moving, hours paused, average speed, and ride description. The highlighted ride shows it's color coded route map, and the bottom has graphs of elevation (green), heartrate (red), speed (blue).

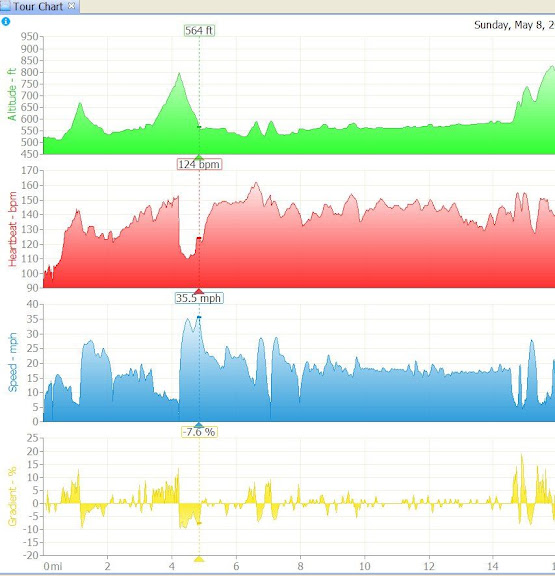
graphs zoomed in, and grade % (yellow)
The map zoomed way in. Each dot is a GPS recorded data point, color coded by speed. You can see the out-and-back tracks on opposite sides of the road.

[/QUOTE]