I like ridewithgps.com for planning routes. I upload a few of my GPS recordings there, too. I can hover over the elevation chart at the bottom, and see the speed, grade, and heartrate at that point in the ride.
ridewithgps has this interesting "Time spent at each speed" graph.

~~~~~~~~~~~~~~~~~~~~~~~~~~~~~~~~~~~~~
I have the
free "
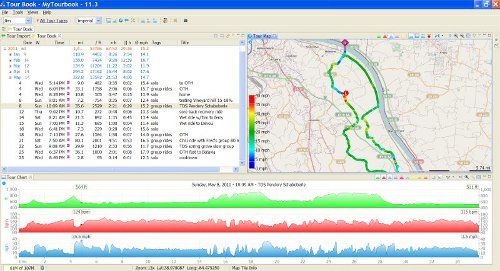
My Tourbook" loaded on my PC, and I import all my GPS recordings to it. It adds up miles, time, elevation, etc, by ride, by month, and by year. The ride is displayed on the map, with the line color coded by speed or heartrate.
This is my normal display. Any panel can be set to full screen, and the map can be zoomed. Top left is the list of rides, including a ride name. At top right is the map, and the bottom shows grade in green, heart rate in red, and speed in blue.
Part of the chart:

A route color coded by speed. Each dot is a GPS recorded waypoint. (They merge together at slower speeds)
