Originally Posted by
rm -rf
Riding S to N:
From the useful weatherspark.com
averages for Astoria Oregon. (The
previous post's link was showing July only--change the URL "/7/" to "/5/" to get
May Averages.)
May winds. The chart doesn't match up with the yearly chart--why ("East" seems to be wrong)?
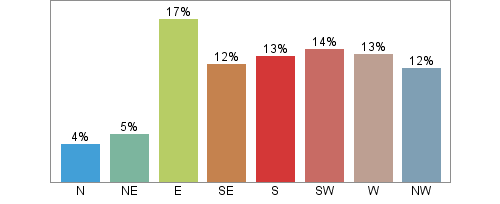
A little N, NE, and the other directions evenly split. Almost no calm days! Of course, any given day could be all one direction.
Yearly:
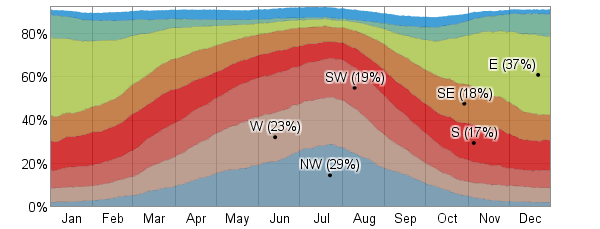
"The fraction of time spent with the wind blowing from the various directions on a daily basis. Stacked values do not always sum to 100% because the wind direction is undefined when the wind speed is zero. "
~~~~~~~~~~~~~~~~~~~~
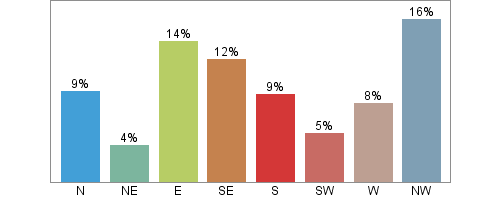
compare to
Arcata CA averages:
Arcata May only
link.
Again this
May winds chart doesn't seem to match with the yearly chart.
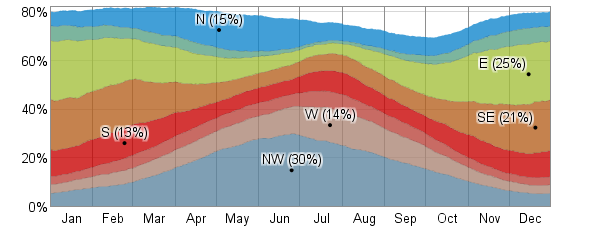
Yearly:
The bar graphs are yearly charts for a given year in Arcata. If you look at the information for May it will show the % time for a given wind direction for the year in the bar graph, 14% east.
The area chart below the bar graph, shows the percent days at a given wind direction for May, east winds are experienced approximately 9-12% of the time on any given day.
At least that is how I interpreted it. It is a little confusing, and I'm easily confused
