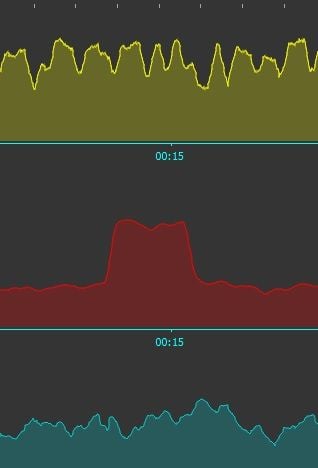
Simply because pictures speak louder than words, here is a graph of 'the event' from Golden Cheetah. The red is HR and the Yellow is power. That spikey look to the power curve is because (even with a strong fan breeze in my face) I generate tons of sweat (literally from around my eye sockets) and each little dip is me wiping the sweat out of my eyes (like every 45 seconds or so). I wear glasses so that natural motion of taking the glasses off and wiping is associated with a 10 to 25% power output drop.
I will probably just wait for my appointment unless this reappears, but the picture is interesting. For scale purposes the width of the red 'event' is between 90 and 120 seconds. The bottom of the HR graph is around 147 bpm and the top is around 170. The grey/blue thing is cadence which is actually varying only a couple rpm.
dave