Originally Posted by
spelger
i still have a lot to learn now that i am gathering data. below is from a zwift training i did a couple of days ago...
before i really started looking at the data i made the incorrect correlation that a rising heart rate indicated increased power output, not so according to the big circled data. the small oval is what i had expected every time (black == power, red == heart rate).
and what is your definition of effort vs long effort? a small 15 second micro burst of power being a short effort? based on what i see below i would agree.
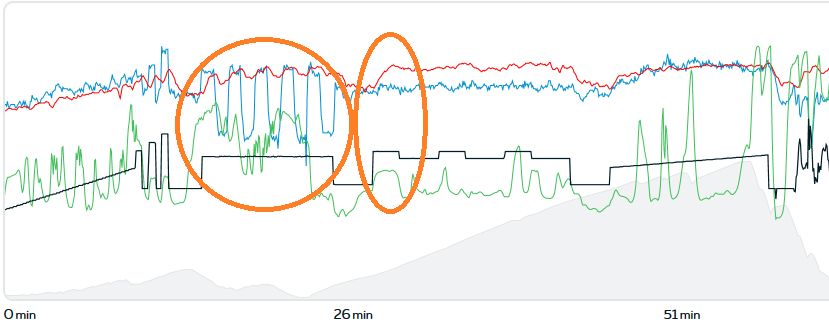
I gather that the gray area is the proxy for altitude, but what are the dark and light green lines? Rising HR is a result of accumulated stress. Of course if you hold a power that's greater than what you could do for a long period, your HR climbs for a while. Unless you are riding at an unsustainable power, eventually HR will stabilize if you hold power steady, although over a long period HR will gradually edge up depending on conditioning and hydration. This is called decoupling, that is HR that doesn't reflect a steady power output. Conditioning decreases decoupling to quite a degree. Cadence always affects HR, higher cadence at the same power will show a higher HR and vice versa. Though even all that isn't totally true. Over longer periods, the length depending on conditioning, hydration, and fueling, HR may be lower at the same power levels compared with 3 or 8 or 15 hours ago, just from exhaustion. There's a lot of information in HR, more information density than power really, just not always the information one expects to see. I mean that power only tells you one thing. HR tells you many things.