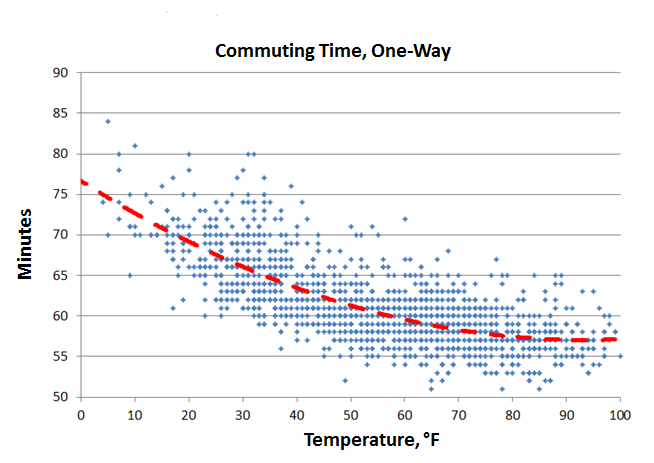
Here is a view of time vs temp on a fixed commuting route I rode in both directions every day for years and years. The dataset represents 5 years of M-F commuting by recumbent, about 1500 data points so 750 different days - I travel alot for work thus nowhere near 250 days per year for those getting out their calculators. I stopped 3 years ago when the local workforce shrank enough they closed the building and I started working from home. I still ride everyday but just an hour at mid-day. There is no correction for headwind, but for sure a lot of the width of the variation on any given duration is wind. Traffic not so much as it was rush hour every time and generally the same traffic. I think the real knee of the curve is more like 55 degrees F but the basic curve fitting in Excel isn't rational where you can get a sharp break and I'm two lazy to split the data and splice together two pictures, etc. The datapoints are very approximate, no stopwatch or ride data app, just checking the time at both ends. Same for temps. But, I thought it was interesting in an overall sense once I had enough data points.