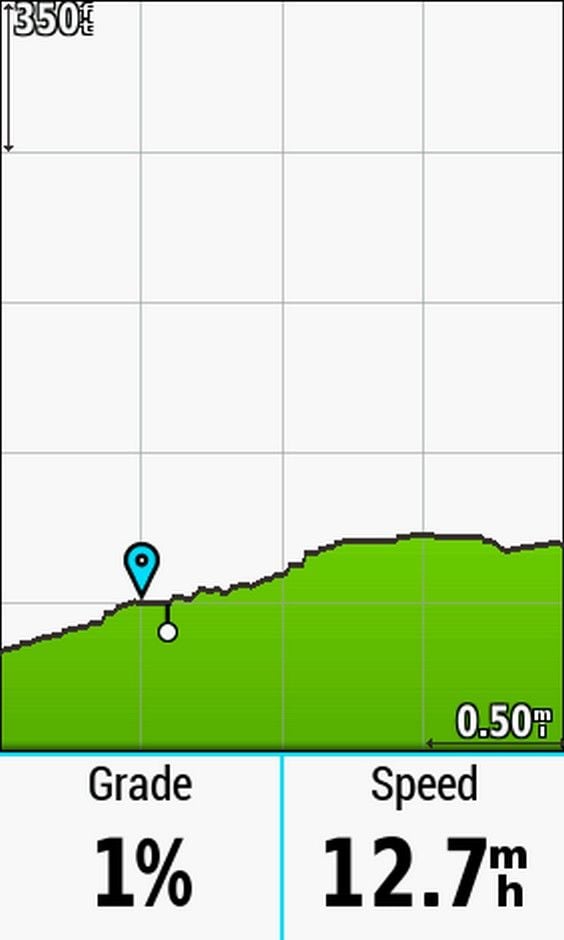
Here's an example of the elevation chart.
My local hills are 100-400 feet high, a mile long or so.
So this scale works great. Each horizontal tickmark line is 0.5 miles, each vertical tickmark line is 350 feet. (You can tap the corner scale numbers and zoom them in or out, too. I normally have it at 200 feet, to see the grades better.)
Following a route, my current position stays at the bottom left tickmark crossing, at the blue flag. The chart scrolls to the left as I ride. So I see the previous 0.5 miles and the next 1.5 miles. Not on a route? it only displays the last 2 miles that I've ridden, not very useful. Elevation data is embedded in the course, not the Garmin maps.
Here, it was a very slight downhill, and the next hill starts in 0.5 miles. From the slope, I see it's around 2% to 4%, with a short, steeper bump toward the top of the displayed hill.
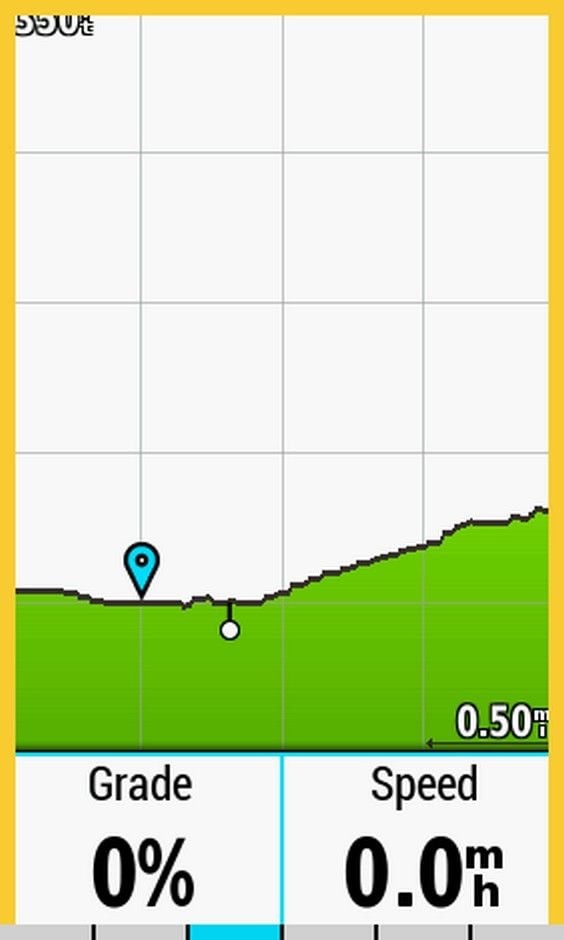
Here, I'm just over that bump. I see the grade is quite easy, then gets steeper toward the end, but that steeper section isn't very tall. After the crest, it's quite easy riding.