Ride recordings need to smooth out the second-by-second raw data!
Each second of the ride is another data point. Slight inaccuracies in location and elevation will produce big swings in the data from one second to the next, up and down.
I save my rides in the free software "
My Tourbook" on my PC, along with Strava.
My Tourbook has settings for the smoothing method and amount. I kept the defaults. Too little smoothing, and there's fake peaks in speed and elevation gain. Too much, and top speeds, gradients, etc, are all rounded off. It's a tricky balance.
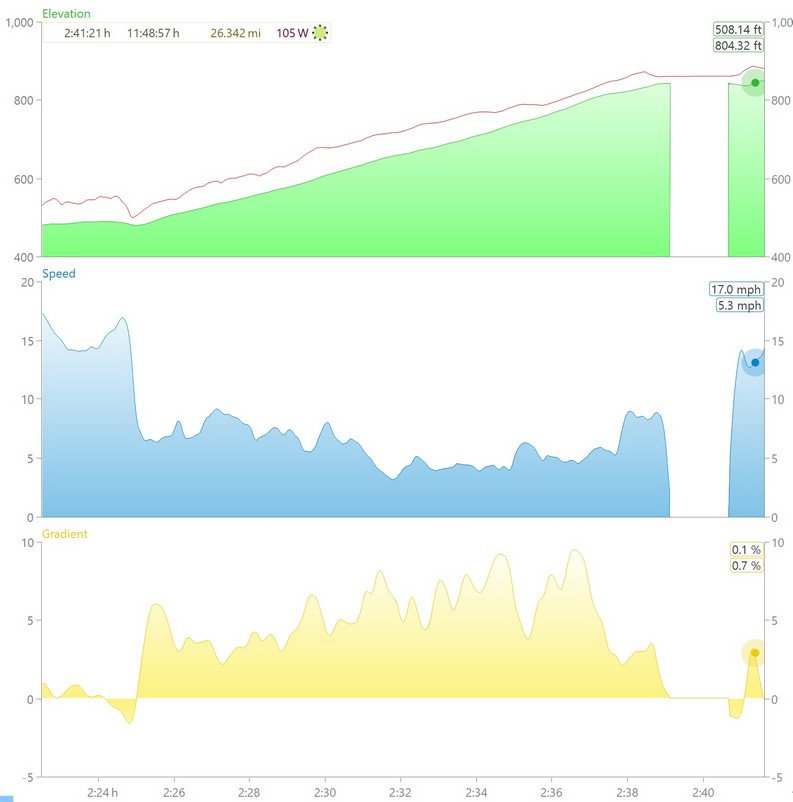
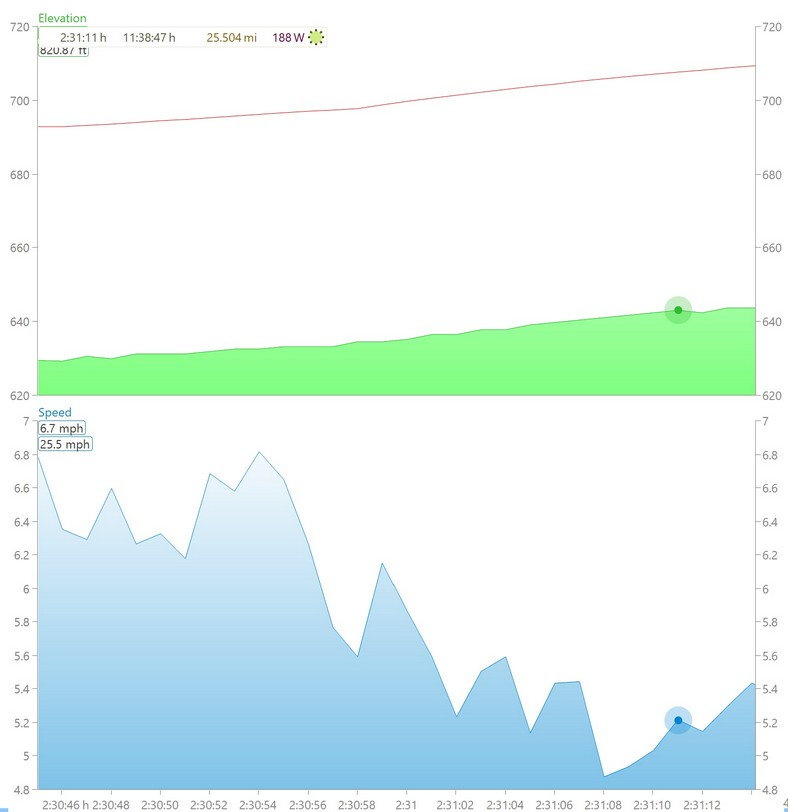
Here's a climb from a recent ride.
The
green graph is elevation from my Garmin 1030. The red line there is satellite elevation data (SRTM data) which can be inaccurate on climbs, since it's data points aren't always on the road surface. You can see where the red line dips when the road crosses a small creek on a bridge. (The strava option to substitute map elevations for the device readings can have the same problems.)
The
blue graph is bike speed. I have a magnet wheel sensor on the back wheel. The smoothing looks pretty good here, no sharp spikes.
The
yellow graph is grade percentage. It's probably more variable than the actual road, which has changes in grade, but no "bumps" or sharp grade changes or switchbacks.
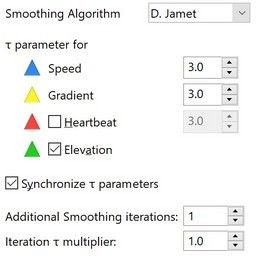
Here's the
smoothing settings. (No, I don't know the theory of this.)
~~~~~~~~~~~~~~~~~
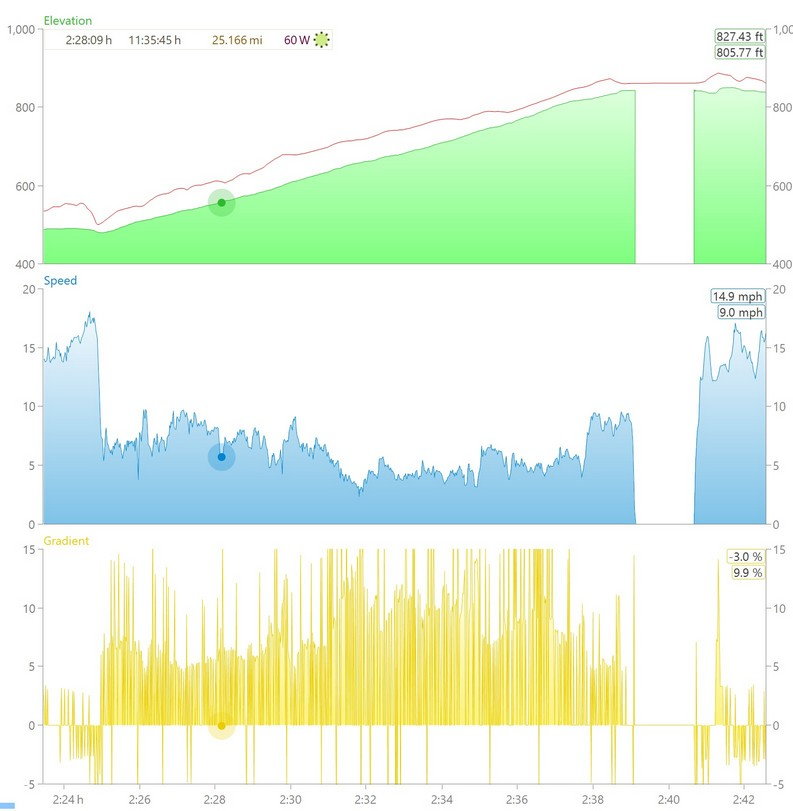
And here's the same graphs with
smoothing turned off!
Totally unusable.
Elevation is reported by the Garmin, and it's smoothed while recording. (I can tell, because there's a 6 second grade% delay before a sudden, steep climb, compared to the power and cadence data.)
Note that the wheel sensor is reasonably accurate, no wild swings in bike speed. It's interesting that even these relatively small speed changes produce such a wide swing in the grade percentage. I'd think it would use the already smoothed elevation to calculate grade, not needing the speed data?
~~~~~~~~~~~~~
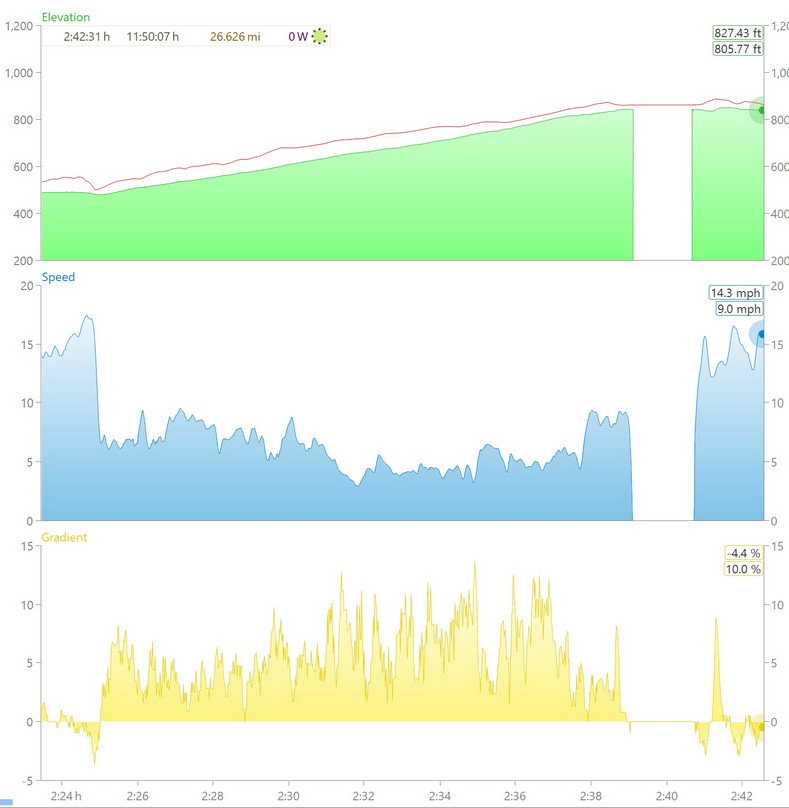
There's also a
simple averaging method, here with a 6-second rolling average. Better than raw data, but still way off.
~~~~~~~~~~~
The raw data zoomed in with no smoothing, to see each one-second data point. Each corner of the blue graph is the next data point. It does seem to have some alternating fast-slow wheel sensor speeds, due to slight changes in the exact timing of where the magnet actually passed by the sensor?
~~~~~~~~~~~~~~~~~~~~~~~~~~~~~~~~~~~~~~~~~~~~~~~~~~~~~~~~~~~~~~~~~~~~~~~~~~~~~~~~~~~~~~~~~
...
GPS location accuracy
GPS can be quite inaccurate with tree cover, with rock hillsides nearby, with reflections of the signals off taller buildings, etc.
But here, out in the open, it's precise.
Each dot is another one-second recording position. Color coded by speed.
See the scale at bottom right, 0.05 miles. That's 264 feet / 80 meters.
I did a rolling stop crossing the highway, no traffic, slowed to see if the other riders got across, then headed downhill to the right side of of the map.
