Originally Posted by
Koyote
Show us an example from a strava or ridewithgps file, and let us know how long it takes you to create it.
Serious request. I'm genuinely curious.
strava -> export to gpx.
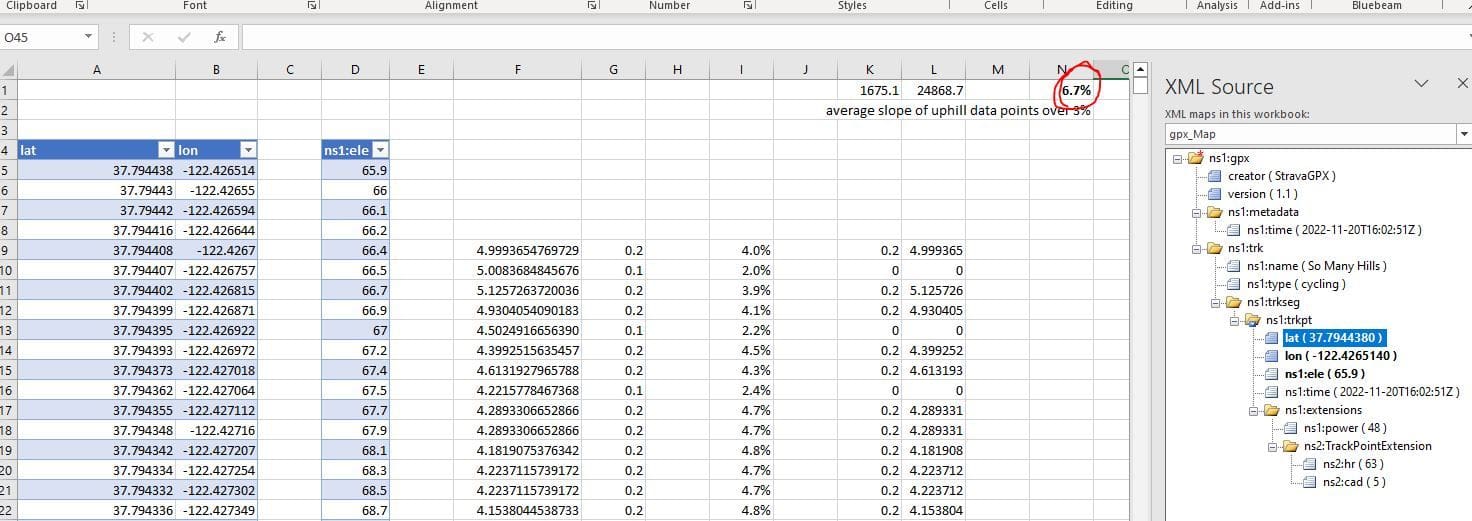
import gpx (as XML) into excel. depending on your data source, some of the elements of the scheme may not be recognized - i ignored errors related to additional data like power balance and so on. from XML source tab, drop lat, lon, and elevation into columns. fill those columns with the data.
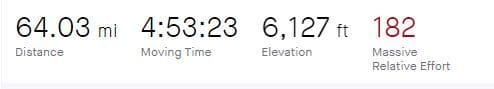
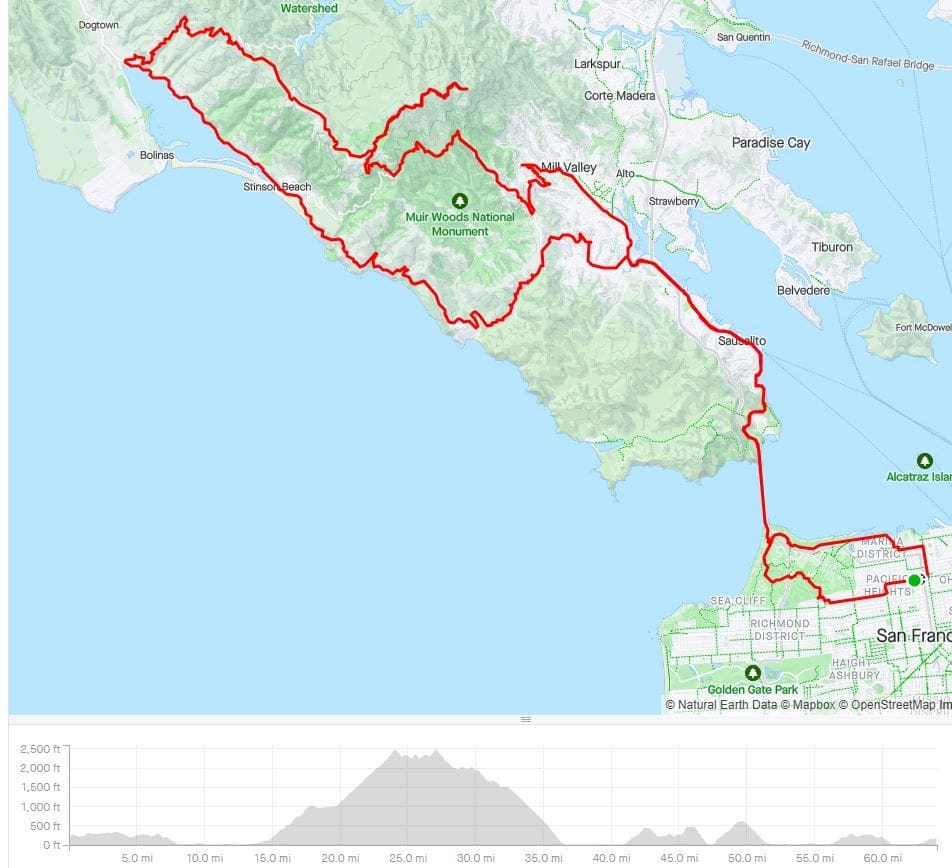
this scheme didn't have distance, so i added the formula to calculate distance from latitude and longitude into column F, returns meters. column G is the change in elevation. column I is the change in elevation over the distance. column K is the change in elevation if it's greater than 3%, and 0 otherwise. column L is the distance if the change in elevation is greater than 3%, and 0 otherwise. K1 and L1 are the sum of those columns, and N1 (bolded number) is the percentage slope in aggregate. this is about what i'd expect - most roads in the bay area are graded to around 6% when they're going uphill. this ride was 64 miles and 6,127 feet of climbing. if you just used those numbers and assumed you went up half the time, then down half the time, you'd get 3.6%, obviously wrong.
this took about 5 minutes plus about 5 minutes refreshing my memory on how to fill the XML data into the columns. it would take about one minute per ride now.
strava summary: