The recent fascination in terms like TSS, ACL, and CTL has increased my curiosity of where these terms originated and the science supporting them. Cursory investigations lead me to the training impulse model of Banister (TRIMP), which was later adapted and adulterated by Coggan.
The training impulse model of Bannister:
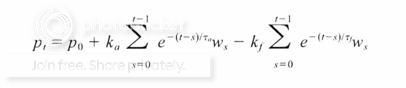
Bannister originally measured the daily training workload (Ws) based on time (T) spent in 5 zones based on %MHR
Ws = 1(Tz1) + 2(Tz2) + 3(Tz3) + 4(Tz4) + 5(Tz5)
Coggan�s first modification was in the way that the workload (Ws) is quantified, using
Ws = T(IF)
IF = Pnorm/Pft
This modification has both advantages and disadvantages. Its primary advantage is that it scores the intensity of the workout relative to a measurable performance parameter that can be adjusted, rather than an arbitrary % of MHR. However, this can also become a disadvantage, as certainly not all metabolic demands are attenuated just because someone becomes very fit. For example, do you think your liver and kidneys etc get �stronger� at the same rate as your LT rises? Maybe to some organs a watt is a watt (or kcal), even if your legs don�t burn anymore. Bannister accepted this limitation but it was more an acceptance that athletes can only endure so much (a maximal but very large trimp), not that it becomes easier (same TSS scores because LT testing results rose), but I digress. Especially considering that all parties seem to agree that the metric used is irrelevant.
The model appears to work equally well regardless of precisely how training has been quantified. (1)
It quickly occurred to me that the arbitrary 7-day moving average for ACL and 42-day moving average for CTL was an unsatisfactory approximation. Furthermore, fitting the model of Banister in a common home spreadsheet program such as MS excel was not as hard as the power 411 might suggest.
Given the relative complexity of the impulse-response model (at least from the perspective of most non-scientists) and the limitations discussed above, many are tempted to simply dismiss the approach out-of-hand as unbelievable �black magic�, or at the very least, as too unpractical for routine use.
The problem, however, is how to do so in a manner that is consistent with the results of this previous scientific research, yet is still simple enough to be used and applied in a real-world setting.(1)
I always try to learn from champions�
�Things should be made as simple as possible, but not any simpler." �Albert Einstein.
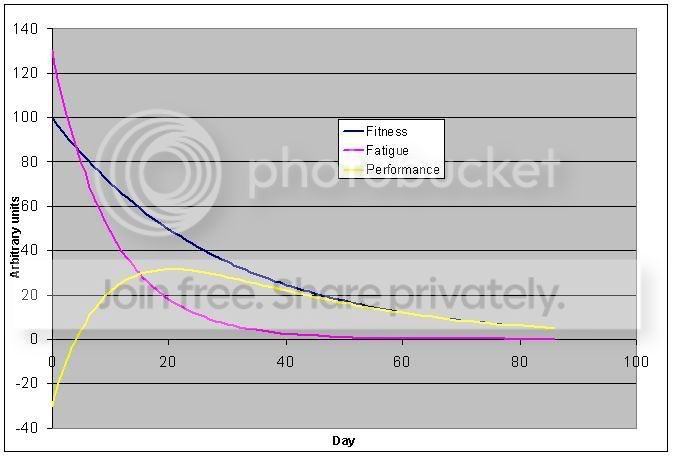
Now here comes the real fun, fitting the decay constants to the training impulse model and comparing the result to the ridiculous approximations the performance manger goes on to make. Personally, I have found that the model constants that most closely match my sensations of fatigue and performance levels are ta: 29.5 tf: 10.5 k1/k2: 1.3 and is shown graphically below (note: this is not the example plot they give you in the power 411).
Now lets demonstrate how the models react to 2 scenarios; in both cases we will define Ws=TSS to make comparisons easier. Ok, two perfectly matched imaginary clients begin cycling training using equal training-volume programs (weekly TSS) with the only alteration being the workout frequency and duration. While both �athletes� will be doing 480TSS of exercise each week, one will do it split up into 6x80TSS and the other will do it in two hard days (2x240TSS). So one has 6 small impulses and the other 2 large impulses. After both functions achieve a steady state the imaginary client completely ceases all training (like a crappy taper). Lets see the results.
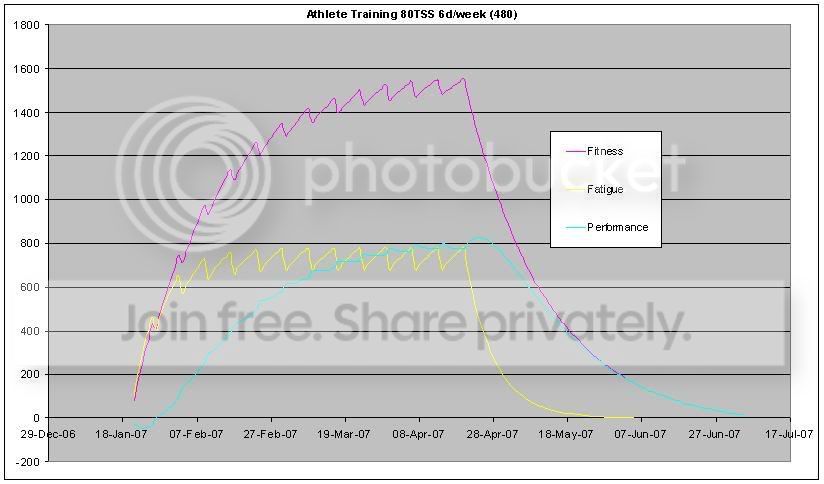
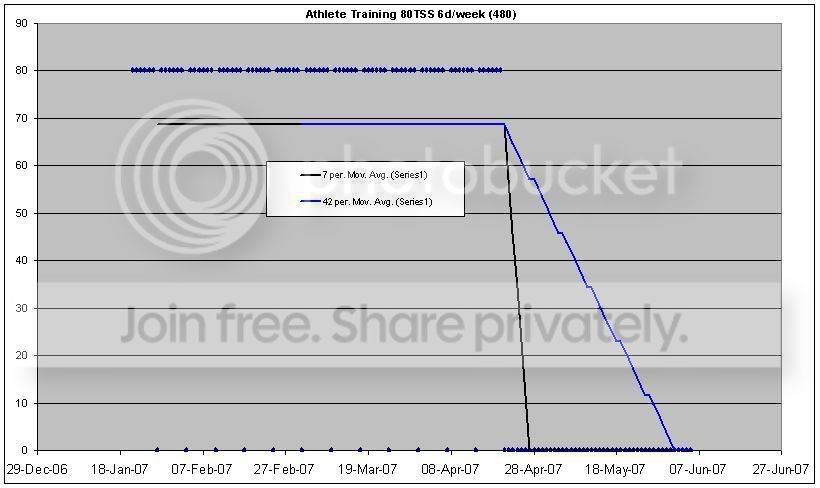
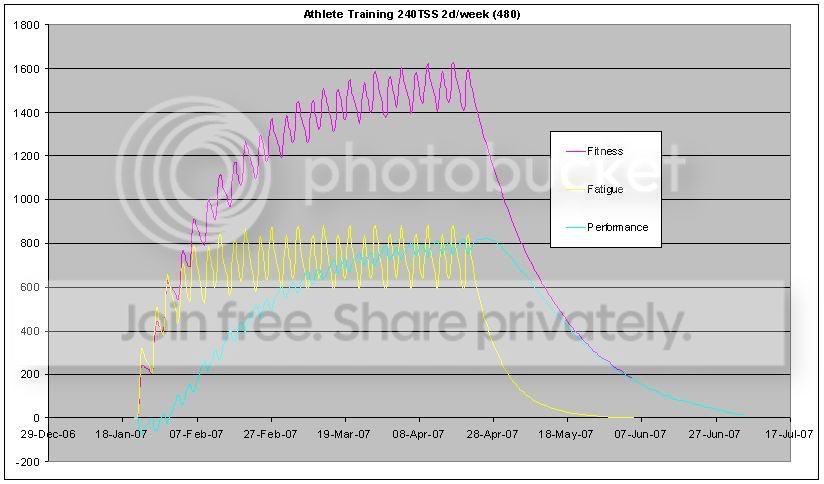
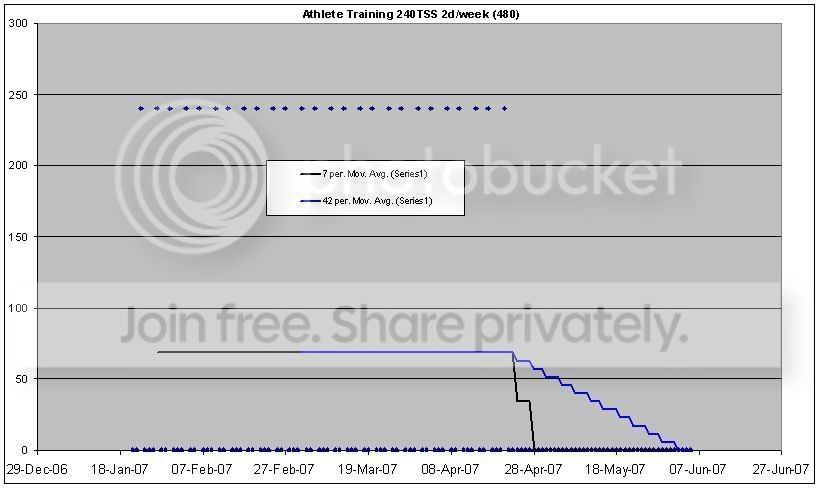
The Bannister model (using the constants I mentioned above) provides a nice illustration of how ones fatigue levels would vary during the training week and may even provide a way of determining a fatigue breakpoint where illness ensues. For example one may find that if they break 2000 imaginary fatigue units they get an infection or overuse injury. The moving average system is not sensitive enough to show much.
The Bannister model also predicts the taper performance maximum quite nicely when compared with user reports (1 week tapers work). Make your own conclusions.
Always, always, always read the source material!
(1)
http://www.cyclingpeakssoftware.com/...gerscience.asp