


degree of incline
 10-14-23, 03:57 AM
#26
Senior Member

Join Date: Oct 2014
Location: Near Lancaster
Posts: 548
Bikes: Carrera Virtuoso and friend
Mentioned: 2 Post(s)
Tagged: 0 Thread(s)
Quoted: 129 Post(s)
Likes: 0
Liked 47 Times
in
38 Posts
all our signposts say stuff like 1 in 4, or 1 in 6. 1 in 6 is hard work, 1 in 4 is suicidal if your going downhill . . . I have had some scary mopments on those, on bikes and in cars.when the handbrake doesn't hold.going up, and you meet someone coming the other way!

Likes For peterws:
10-14-23, 06:58 AM
#27
Senior Member

Join Date: Sep 2017
Location: Upstate SC
Posts: 1,716
Mentioned: 3 Post(s)
Tagged: 0 Thread(s)
Quoted: 829 Post(s)
Liked 1,676 Times
in
789 Posts
 10-14-23, 07:09 AM
#28
Senior Member
Join Date: May 2021
Posts: 8,520
Mentioned: 16 Post(s)
Tagged: 0 Thread(s)
Quoted: 4451 Post(s)
Liked 4,911 Times
in
3,041 Posts
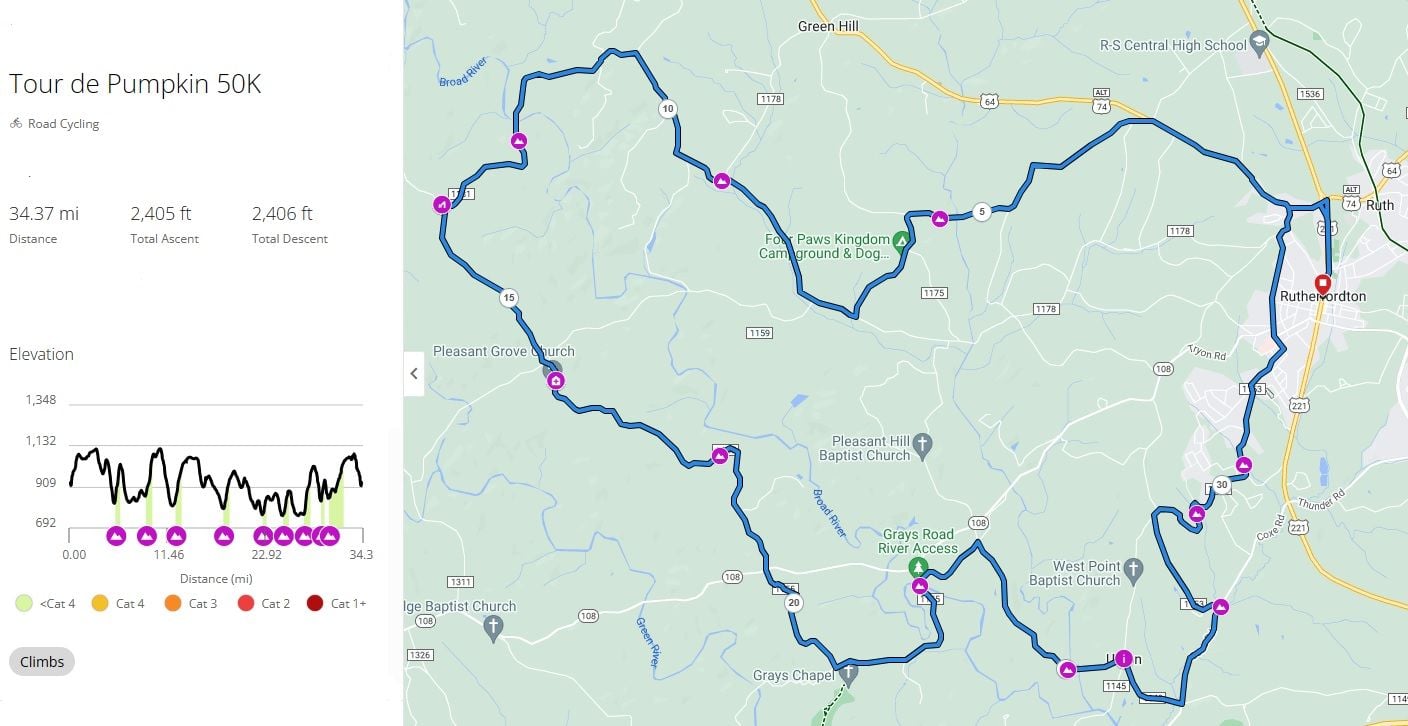
I use Garmin Connect whenever I'm going on a ride where the route is published beforehand, usually in RWGPS. Just export the RWGPS file as .TCX and then import it into Connect. The climbs and rest stops will show up on the Garmin map, and when you send the route to your unit, they will show up as you ride. ClimbPro will tell you the gradient of the climb and how much longer you'll have to suffer.
Likes For PeteHski:
10-14-23, 08:11 AM
#29
Cheerfully low end
Join Date: Jun 2020
Posts: 1,979
Mentioned: 5 Post(s)
Tagged: 0 Thread(s)
Quoted: 646 Post(s)
Liked 1,045 Times
in
668 Posts
I ride with platform pedals and shoes I can comfortably run or walk in. There are certain routes that have hills that I just get off and walk. One in particular is very tall for this area, very steep and loose gravel. I�ve climbed it in 40x32 but traction is a really challenge. Kind of a relief with SS to just get off and walk.
Otto
Likes For ofajen:
10-14-23, 11:47 AM
#30

feros ferio

Join Date: Jul 2000
Location: www.ci.encinitas.ca.us
Posts: 21,805
Bikes: 1959 Capo Modell Campagnolo; 1960 Capo Sieger (2); 1962 Carlton Franco Suisse; 1970 Peugeot UO-8; 1982 Bianchi Campione d'Italia; 1988 Schwinn Project KOM-10;
Mentioned: 44 Post(s)
Tagged: 0 Thread(s)
Quoted: 1393 Post(s)
Liked 1,334 Times
in
840 Posts
How about Fargo St. near downtown Los Angeles? 32%
https://losangelesexplorersguild.com...%20the%201970s.
They have an annual bicycle climb event. I would not even think about riding down that thing.
Update: the city hosed us over by changing this to one-way downhill, as they did to my favorite climb, Tuna Canyon in Malibu, destroying that one, as well.
__________________
"Far and away the best prize that life offers is the chance to work hard at work worth doing." --Theodore Roosevelt
Capo: 1959 Modell Campagnolo, S/N 40324; 1960 Sieger (2), S/N 42624, 42597
Carlton: 1962 Franco Suisse, S/N K7911
Peugeot: 1970 UO-8, S/N 0010468
Bianchi: 1982 Campione d'Italia, S/N 1.M9914
Schwinn: 1988 Project KOM-10, S/N F804069
10-14-23, 03:48 PM
#31
don't try this at home.

Join Date: Jan 2006
Location: N. KY
Posts: 5,950
Mentioned: 10 Post(s)
Tagged: 0 Thread(s)
Quoted: 980 Post(s)
Liked 512 Times
in
352 Posts
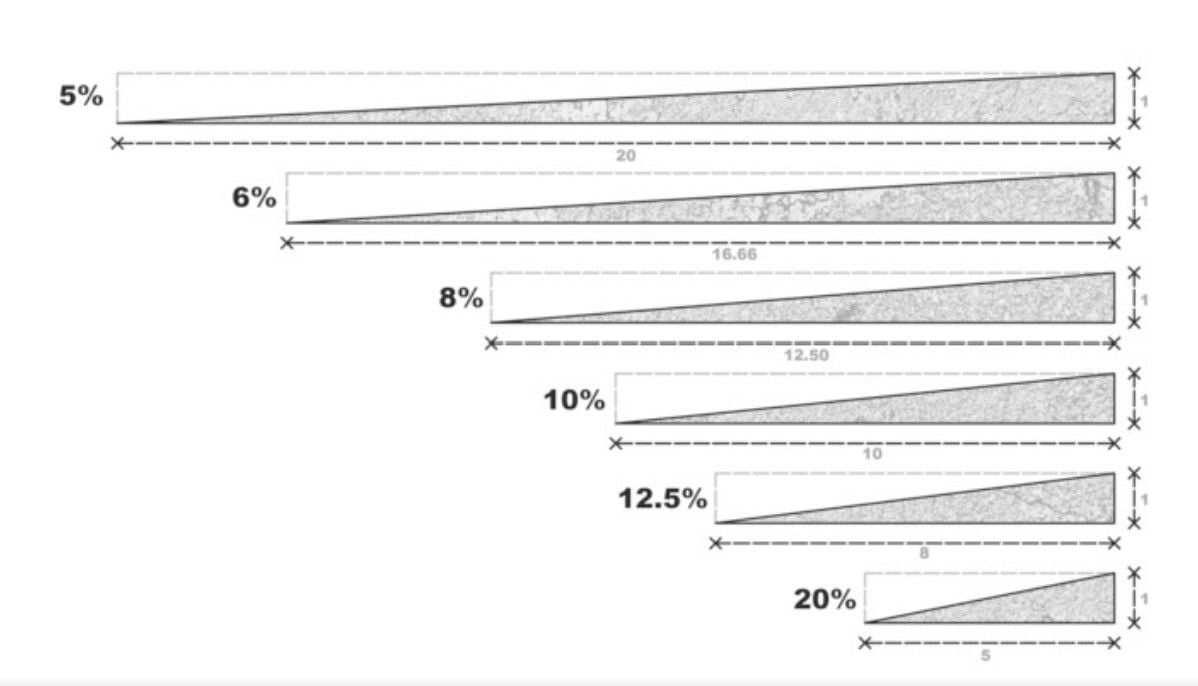
Grade profiles!
Ha, these look extremely easy when drawn. Using the profiles vs real life:
5%: Will I even notice this? vs "a real hill. breathing harder, set a maintainable pace here."
10%: Easy. vs "no more lower gears. How long is this section?"
20%: Might have to use some effort on this. Not too difficult. vs "Using my 1 minute max power. Hope I reach the crest by then!
Likes For rm -rf:
10-14-23, 04:10 PM
#32
don't try this at home.
Join Date: Jan 2006
Location: N. KY
Posts: 5,950
Mentioned: 10 Post(s)
Tagged: 0 Thread(s)
Quoted: 980 Post(s)
Liked 512 Times
in
352 Posts
Finding grades
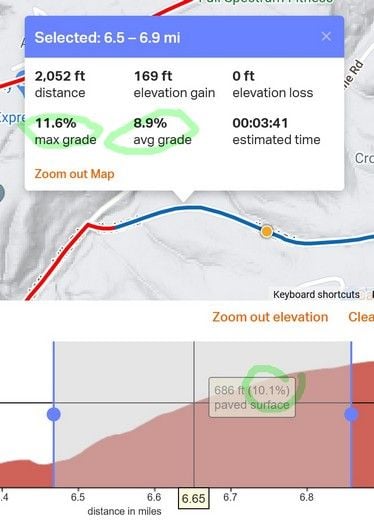
ridewithgps.com can show average grades on a selected portion of a climb. It can show max grade and grade at a point in the route, but those can be inaccurate, due to using known data points from the mapping to estimate a point in between those. Usually reasonably close, though. The average is quite accurate most of the time.
Like this example. I dragged a portion of the red elevation chart to show it's stats in the box, and moved the cursor to find the local grade there (which can sometimes be anywhere from 8% to 12-13% in real life.)
8.9% isn't that hard for me at 169 feet tall. If it was 400 feet, I'd have more trouble maintaining my pace up the hill.
~~~~~~~~~~~~~~
Accurate spot grades with a phone app
A couple of years ago, I was interested in a couple of the "steepest climb around" hills. These are very hard to measure accurately with a GPS device, since the bike is going slow, there's often tree cover to interfere with GPS, and any small data error will throw off the calculations significantly.
I have a bubble level app on my phone. It's accurate to well within 1% grade, tested using my accurate wood shop 4 foot level. I have the phone sitting on it and the level shimmed so the bubble is exactly centered.
Next, I set the bike on a known level floor. The top tube slopes to the back, so I zeroed the app on an exactly level tabletop,then set it's bottom edge on the top tube near the stem.
It read "14.3 percent" with my bike level. So I can hand tilt the phone to 14.3%, the press the Zero setting. now it reads "zero %" correctly when sitting on the bike, and I just stop the bike, feet on the ground, phone on the top tube, and read off the actual grade at that point in the road.
(That steep climb was measured when I rode it downhill and stopped to measure. 21% part way down, 22% nearby. Ha, it's not easy to come to a complete stop on a hill that steep!)
Last edited by rm -rf; 10-14-23 at 04:39 PM.
10-14-23, 10:08 PM
#33

Grupetto Bob

Join Date: Sep 2020
Location: Seattle-ish
Posts: 6,244
Bikes: Bikey McBike Face
Mentioned: 2 Post(s)
Tagged: 0 Thread(s)
Quoted: 2600 Post(s)
Liked 5,680 Times
in
2,932 Posts
You are right. I confused altimeter with gradient. The Avocet did not display gradient, only total gain or loss.
__________________
Road 🚴🏾♂️ & Mountain 🚵🏾♂️
Road 🚴🏾♂️ & Mountain 🚵🏾♂️
Likes For rsbob:
10-15-23, 06:55 AM
#34
Senior Member
Join Date: Feb 2012
Location: Golden, CO and Tucson, AZ
Posts: 2,842
Bikes: 2012 Specialized Elite Disc, 1983 Trek 520
Mentioned: 13 Post(s)
Tagged: 0 Thread(s)
Quoted: 678 Post(s)
Liked 744 Times
in
433 Posts
After a short but steep climb in the Tucson area, a visiting friend asked what the gradient was. I had no idea, so I guessed 10%. He disagreed, saying it felt more like 13%. When we got home, I checked the state highway website, and they actually listed the gradients of the steepest roads in the state, probably for truckers, RVers, etc. It listed this particular road (Gates Pass) at 13%! I was impressed with my friend's guess.
10-15-23, 07:34 AM
#35
Senior Member
Join Date: May 2021
Posts: 8,520
Mentioned: 16 Post(s)
Tagged: 0 Thread(s)
Quoted: 4451 Post(s)
Liked 4,911 Times
in
3,041 Posts
After a short but steep climb in the Tucson area, a visiting friend asked what the gradient was. I had no idea, so I guessed 10%. He disagreed, saying it felt more like 13%. When we got home, I checked the state highway website, and they actually listed the gradients of the steepest roads in the state, probably for truckers, RVers, etc. It listed this particular road (Gates Pass) at 13%! I was impressed with my friend's guess.
Likes For PeteHski:
10-15-23, 05:23 PM
#36
ignominious poltroon

Join Date: Jan 2022
Posts: 4,078
Mentioned: 3 Post(s)
Tagged: 0 Thread(s)
Quoted: 2252 Post(s)
Liked 3,464 Times
in
1,817 Posts
10-15-23, 06:25 PM
#37
Senior Member
Join Date: May 2021
Posts: 8,520
Mentioned: 16 Post(s)
Tagged: 0 Thread(s)
Quoted: 4451 Post(s)
Liked 4,911 Times
in
3,041 Posts
Likes For PeteHski:
10-15-23, 07:32 PM
#38
climber has-been

Join Date: Dec 2004
Location: Palo Alto, CA
Posts: 7,150
Bikes: Scott Addict R1, Felt Z1
Mentioned: 10 Post(s)
Tagged: 0 Thread(s)
Quoted: 3465 Post(s)
Liked 3,607 Times
in
1,809 Posts
To be fair, determining grade from the data is not easy. The GPS data are noisy, and even if it were perfect, the best you can get is the grade behind you.
I wrote a tiny web app to show elevation and grade, so I could tell the missus how hard our hike was. Noisy data makes for noisy grade estimates.
https://myelevation.terrymorse.com
I wrote a tiny web app to show elevation and grade, so I could tell the missus how hard our hike was. Noisy data makes for noisy grade estimates.
https://myelevation.terrymorse.com
__________________
Ride, Rest, Repeat. ROUVY: terrymorse

Ride, Rest, Repeat. ROUVY: terrymorse
Likes For terrymorse:
10-16-23, 03:14 AM
#40
Senior Member
Join Date: May 2021
Posts: 8,520
Mentioned: 16 Post(s)
Tagged: 0 Thread(s)
Quoted: 4451 Post(s)
Liked 4,911 Times
in
3,041 Posts
10-16-23, 03:20 AM
#41
Senior Member
Join Date: May 2021
Posts: 8,520
Mentioned: 16 Post(s)
Tagged: 0 Thread(s)
Quoted: 4451 Post(s)
Liked 4,911 Times
in
3,041 Posts
To be fair, determining grade from the data is not easy. The GPS data are noisy, and even if it were perfect, the best you can get is the grade behind you.
I wrote a tiny web app to show elevation and grade, so I could tell the missus how hard our hike was. Noisy data makes for noisy grade estimates.
https://myelevation.terrymorse.com
I wrote a tiny web app to show elevation and grade, so I could tell the missus how hard our hike was. Noisy data makes for noisy grade estimates.
https://myelevation.terrymorse.com
10-16-23, 09:15 AM
#42
climber has-been
Join Date: Dec 2004
Location: Palo Alto, CA
Posts: 7,150
Bikes: Scott Addict R1, Felt Z1
Mentioned: 10 Post(s)
Tagged: 0 Thread(s)
Quoted: 3465 Post(s)
Liked 3,607 Times
in
1,809 Posts
I knew a guy who was working on a device using 2 accelerometers and a speed sensor to display grade. I don't think he ever got it to work.
__________________
Ride, Rest, Repeat. ROUVY: terrymorse
Ride, Rest, Repeat. ROUVY: terrymorse
10-16-23, 09:39 AM
#43
Perceptual Dullard
Join Date: Sep 2009
Posts: 2,441
Mentioned: 36 Post(s)
Tagged: 0 Thread(s)
Quoted: 929 Post(s)
Liked 1,174 Times
in
502 Posts
I can also differentiate turns from the straights on velodromes. A friend has been using RTK GPS to validate the virtual slope calculations. So far so good.
Likes For RChung:
10-16-23, 09:44 AM
#44
Senior Member
Join Date: Sep 2005
Location: In the foothills of Los Angeles County
Posts: 25,330
Mentioned: 8 Post(s)
Tagged: 0 Thread(s)
Quoted: 8307 Post(s)
Liked 9,102 Times
in
4,499 Posts
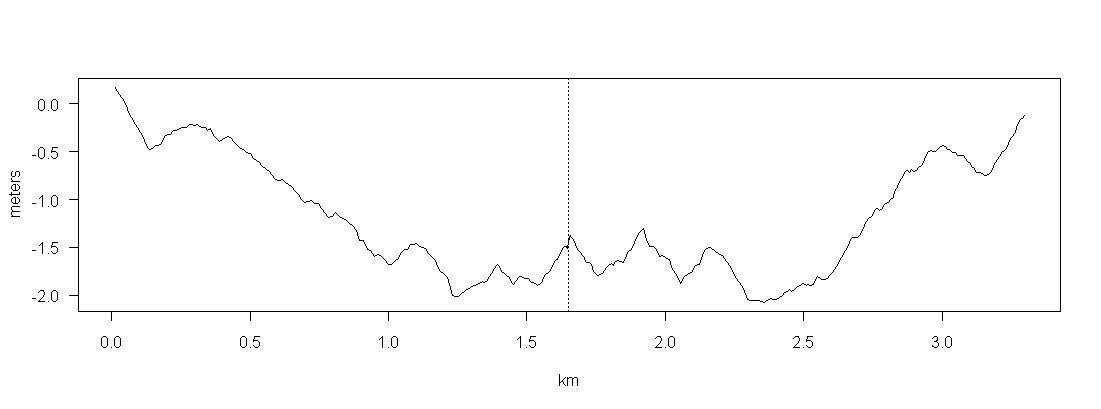
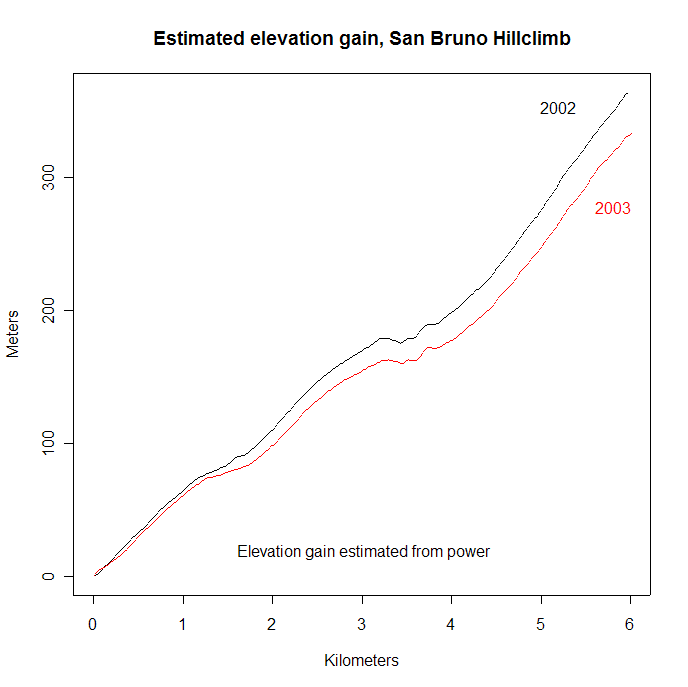
I came up with virtual elevation (and virtual slope) 20 years ago back when I was trying to figure out a way to assess the quality of power meter data. Since then, people have mostly used it to estimate CdA and Crr but I can pretty reliably spot small changes in gradient. Here's a plot of the calculated gradient along the Bay Trail in Berkeley alongside I-80 from University Ave south one mile. This was for an out-and-back on a "flat" trail, and there was a tiny tail wind on the out (headwind on the return); I attribute the slight asymmetry in the two halves of the profile to that. Note the scale. As an aside, I hadn't noticed that first dip at about 150m from the start/end. That's about a 25cm "local minimum." I was skeptical, so I went out there the next day, rolled out 150m from the start, and saw that there was dried-up silt at that point. That's where water was collecting.
10-16-23, 10:00 AM
#45
Perceptual Dullard
Join Date: Sep 2009
Posts: 2,441
Mentioned: 36 Post(s)
Tagged: 0 Thread(s)
Quoted: 929 Post(s)
Liked 1,174 Times
in
502 Posts
The first is from the 2002 and 2003 New Year's Day San Bruno Hillclimbs (I told you I was doing this 20 years ago). The rider was the same, but 2003 was much windier. San Bruno is pretty open, there's no tree cover so it's pretty susceptible to wind. Nonetheless, you can see how the profile derived from power and speed match.
The second plot is from a climb of Mt. Palomar, along with elevation from the barometer of an Avocet 50. You can see that this works much better on the climb than on the descent, where the rider was using his brakes.
 10-16-23, 10:04 AM
#46
Senior Member
Join Date: Sep 2005
Location: In the foothills of Los Angeles County
Posts: 25,330
Mentioned: 8 Post(s)
Tagged: 0 Thread(s)
Quoted: 8307 Post(s)
Liked 9,102 Times
in
4,499 Posts
Very interesting stuff!
10-16-23, 10:43 AM
#47
I'm good to go!
Join Date: Jul 2017
Location: Mississippi
Posts: 15,062
Bikes: Tarmac Disc Comp Di2 - 2020
Mentioned: 51 Post(s)
Tagged: 0 Thread(s)
Quoted: 6233 Post(s)
Liked 4,837 Times
in
3,335 Posts
Grade is much like Calories. I never understand why people expect the device to show them accurately, and especially instantly. Or even consistently between any two rides.
10-16-23, 12:05 PM
#48
Been Around Awhile

Join Date: Oct 2004
Location: Burlington Iowa
Posts: 29,987
Bikes: Vaterland and Ragazzi
Mentioned: 0 Post(s)
Tagged: 0 Thread(s)
Quoted: 12 Post(s)
Liked 1,539 Times
in
1,048 Posts
 10-16-23, 12:50 PM
#49
Perceptual Dullard
Join Date: Sep 2009
Posts: 2,441
Mentioned: 36 Post(s)
Tagged: 0 Thread(s)
Quoted: 929 Post(s)
Liked 1,174 Times
in
502 Posts
In a big picture kind of way, they want grade and elevation change so they can see how hard a ride is, was, or will be; or to communicate to someone else about a ride's difficulty. But if you have a power meter you don't really need grade or elevation change: power tells you much more about how hard it is, or was (not so much will be). Power for speed is a direct measurement of how hard it is, and those get updated every second with pretty high precision and accuracy, so "translating" power and speed into grade is an easier problem than trying to translate approximate grade or elevation change into difficulty.
Likes For RChung:
10-16-23, 02:38 PM
#50
climber has-been
Join Date: Dec 2004
Location: Palo Alto, CA
Posts: 7,150
Bikes: Scott Addict R1, Felt Z1
Mentioned: 10 Post(s)
Tagged: 0 Thread(s)
Quoted: 3465 Post(s)
Liked 3,607 Times
in
1,809 Posts
Yeah.
In a big picture kind of way, they want grade and elevation change so they can see how hard a ride is, was, or will be; or to communicate to someone else about a ride's difficulty. But if you have a power meter you don't really need grade or elevation change: power tells you much more about how hard it is, or was (not so much will be).
In a big picture kind of way, they want grade and elevation change so they can see how hard a ride is, was, or will be; or to communicate to someone else about a ride's difficulty. But if you have a power meter you don't really need grade or elevation change: power tells you much more about how hard it is, or was (not so much will be).
I just finished some climbs with 15% sections, and my quads feel it. Aerobically, not so bad.