


How are the Ebikes and Bikes Lanes in your city?
 11-26-23, 07:08 PM
#76

Rider. Wanderer. Creator.

Join Date: May 2007
Location: New Jersey
Posts: 774
Bikes: Bike Friday Pocket Rocket, Cinelli Hobootleg, Zizzo Liberte
Mentioned: 0 Post(s)
Tagged: 0 Thread(s)
Quoted: 394 Post(s)
Liked 781 Times
in
377 Posts
John, I implore you to develop the habit of reading the source material you cite. Your inability or unwillingness to do so has become repetitive, and is wasting everyone's time. That chart is not the source data. The source data is on page 20, as I already told you, and I will quote it for you:
"The New York State 2009 NHTS Comparison Report (Oak Ridge National Laboratory, 2012) indicates that 18.2% of trips that New Yorkers take using personal vehicles are commuting trips to work. This would indicate that potentially 536,000 (97,600/18.2%) total bicycle trips are taken each day."
365 days times 536,000 daily trips is just shy of 200M annual trips -- starting almost a decade a ago.
You're still wrong.

Ball's in your court, buddy.
 11-26-23, 07:35 PM
#77
NoElectricAssist
Join Date: Jul 2023
Location: Middle Tennessee
Posts: 4
Bikes: 2018 ICE SprintX w/Schlumpf 2.5 speed drive. 2020 Trek Checkpoint
Mentioned: 0 Post(s)
Tagged: 0 Thread(s)
Quoted: 1 Post(s)
Likes: 0
Liked 0 Times
in
0 Posts
In my area, 12 miles away from the city we have a bike lane on one of the most traveled 4lane highways in the county. This one particular lane I can count on one hand how many bikes I�ve seen on it in my 40 years of driving it. Total waste of tax dollars IMO. Plus they seldom clean it.
It does lead to a train depot and crosses another busy 4lane. At least on this route you can access a greenway which will give you a scenic route all the way to downtown.
We do have some nice greenways but what would be super is to have the bike lanes where you can easily jump on the greenways. Doing so would connect multiple neighborhoods. I guess that would make too much sense.
Personally, riding in this city would be too dangerous with or without bike lanes.
11-26-23, 07:40 PM
#78
Full Member
Funny how you're ignoring "potentially" in "potentially 536,000 (97,600/18.2%) total bicycle trips are taken each day" and simply multiplying by 365. What happened to seasonality? You do realize that New York has winters? That's a fundamental and egregious error that throws your whole argument that bicycle trips have not increased since 2015 out the window.
If I am, then so are they. So you need to find better data -- which doesn't exist, because as I already explained, you are arguing a lost cause.
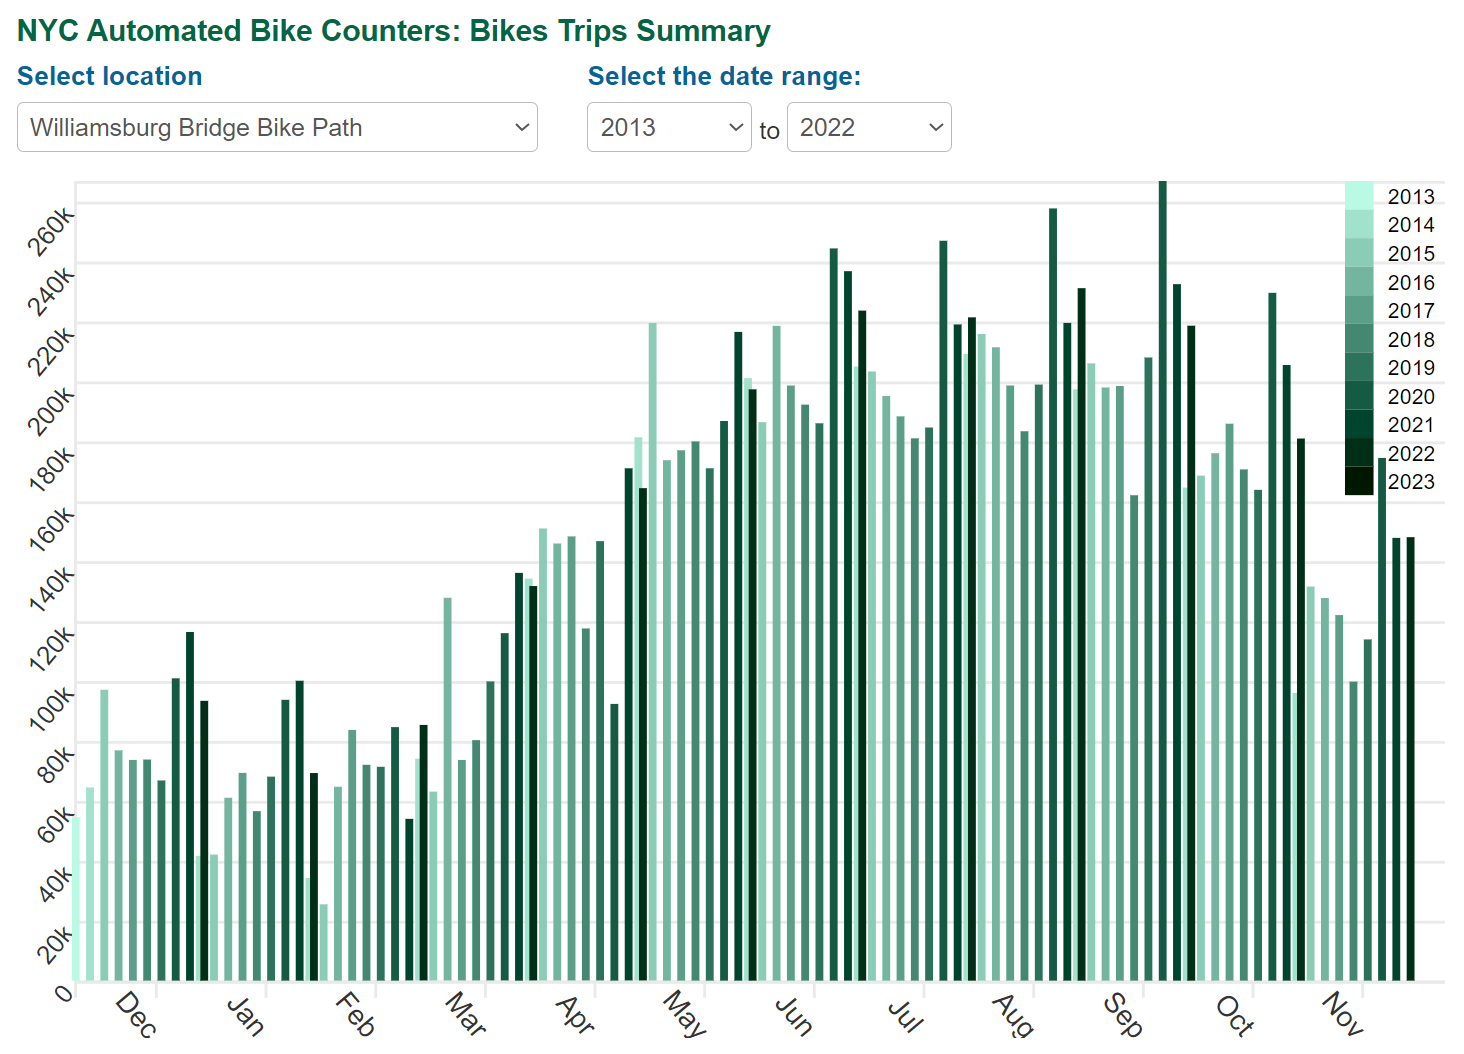
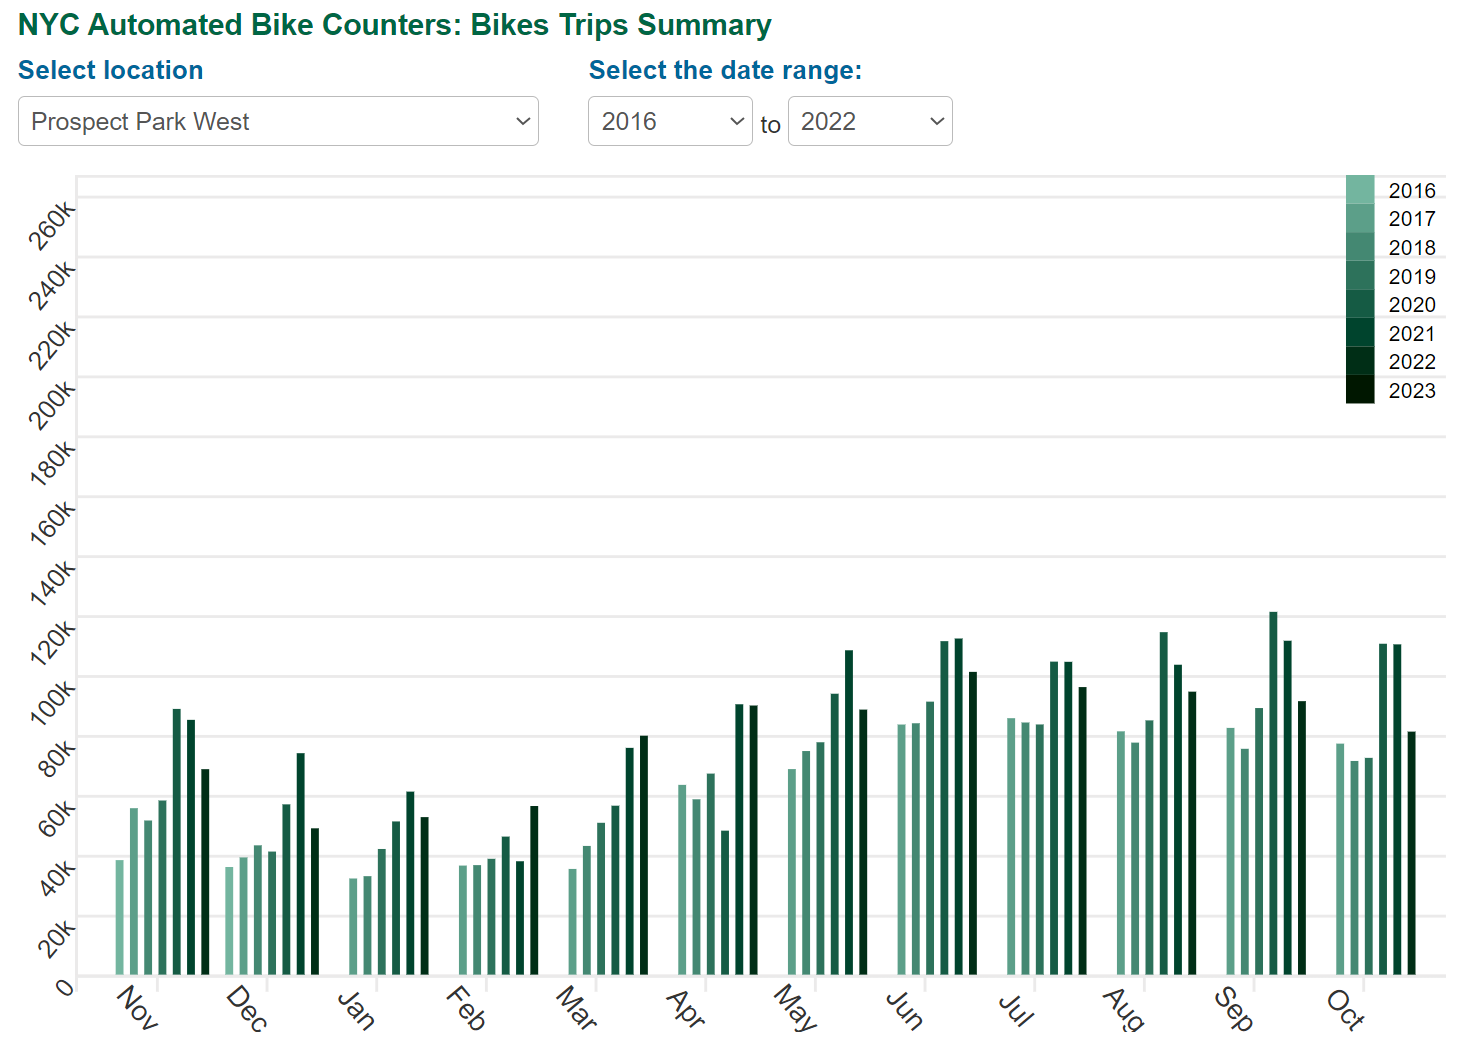
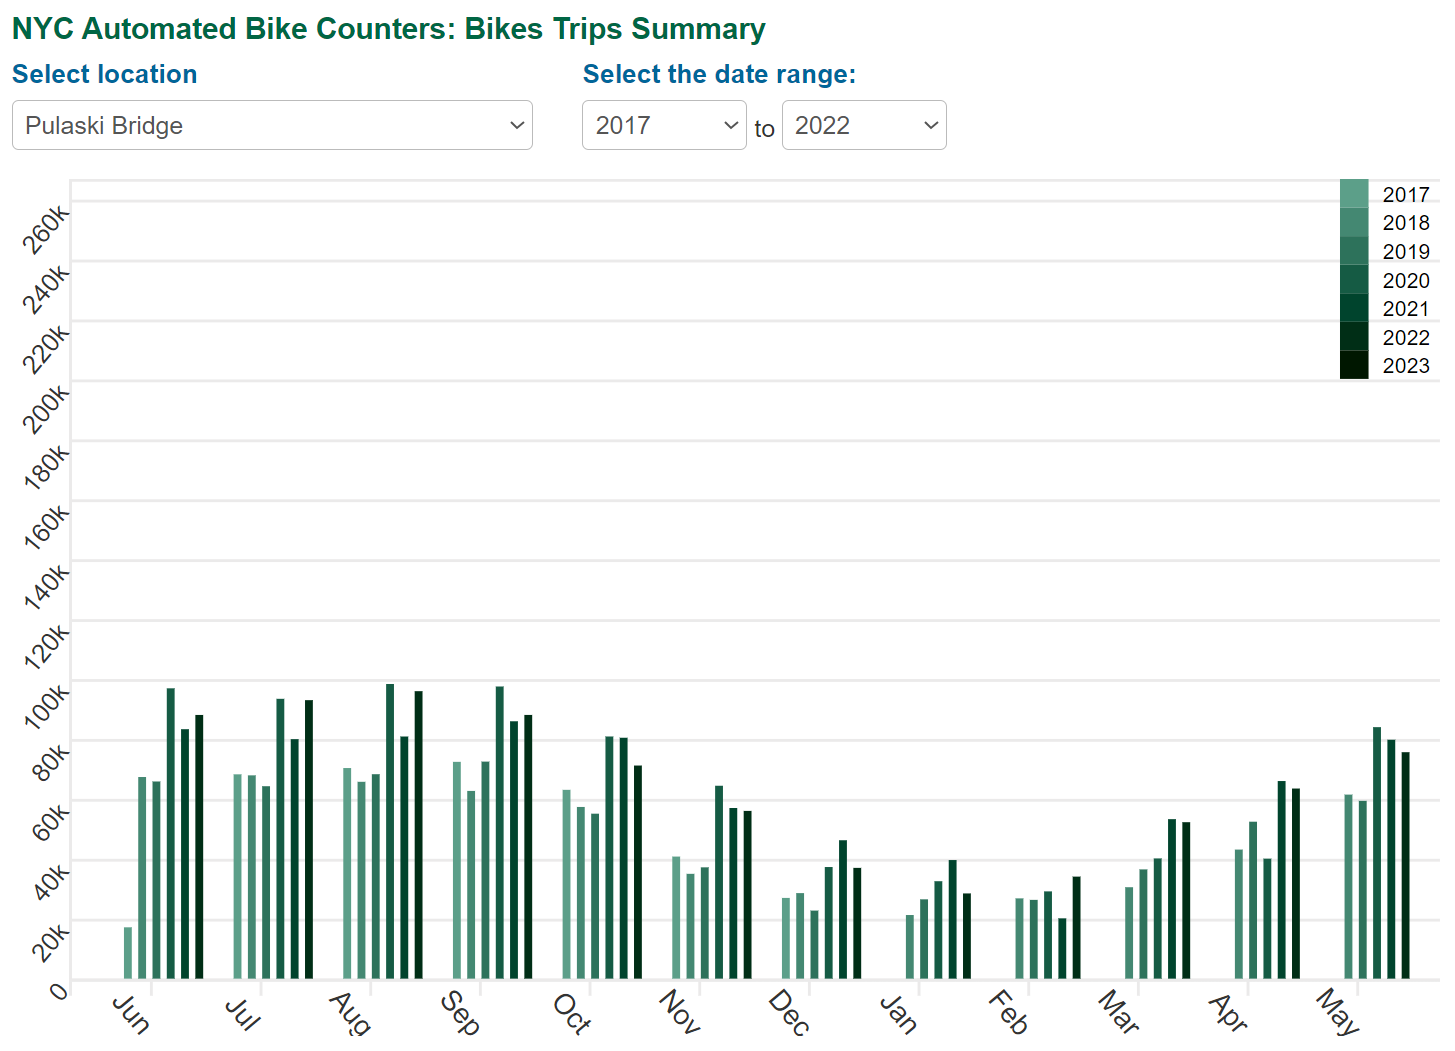
None of those charts support your claimed 34% increase in trips from 2013 to 2018. They also don't support the monotonic increase claimed in your original chart. Again, if you are going to post charts, it would behoove you to understand them first, and even better would be to find some that support your point, instead of contradicting it.
No, we are not, we're talking about the street-level counts on pages 22 and 23 in the Appendix -- that you should've read before starting this mess. We already covered the bridges in the preceding paragraph, and moved on to the street counts. Again, try to keep up.
Finally, I note with interest that you declined to comment on the summary:
"Simplifying to wrap up, NYC hit about 200M annual bicycle trips in 2015 and had 14 fatalities, and 4896 injuries ( officially ). It reached about 220M trips last year, and had 18 fatalities, and 4949 injuries ( again, official count, not worth much ). ( All per NYC.gov bicycle crash data reports, and the aforementioned trip estimates. )"
11-26-23, 07:40 PM
#79
Happy With My Bikes

Join Date: Sep 2020
Location: Oklahoma
Posts: 2,187
Bikes: Hi-Ten bike boomers, a Trek Domane and some projects
Mentioned: 2 Post(s)
Tagged: 0 Thread(s)
Quoted: 884 Post(s)
Liked 2,308 Times
in
1,118 Posts
I must apologize. I incorrectly stated earlier in this thread that I thought there was a potential for this to be an e-bike bashing opportunity.
__________________
"It is the unknown around the corner that turns my wheels." -- Heinz St�cke
"It is the unknown around the corner that turns my wheels." -- Heinz St�cke
Likes For Chuck M:
11-26-23, 08:28 PM
#80
Method to My Madness
Join Date: Nov 2020
Location: Orange County, California
Posts: 3,663
Bikes: Trek FX 2, Cannondale Synapse, Cannondale CAAD4, Santa Cruz Stigmata GRX
Mentioned: 4 Post(s)
Tagged: 0 Thread(s)
Quoted: 1948 Post(s)
Liked 1,471 Times
in
1,020 Posts
Irvine doesn't have a particularly impressive safely record, per the League of American Bicyclists, and scores only 4.19/10 for its Engineering, and even worse for "Evaluation & Planning".
BFA Awards Database | League of American Bicyclists (bikeleague.org)
11-26-23, 08:54 PM
#81
Rider. Wanderer. Creator.
Join Date: May 2007
Location: New Jersey
Posts: 774
Bikes: Bike Friday Pocket Rocket, Cinelli Hobootleg, Zizzo Liberte
Mentioned: 0 Post(s)
Tagged: 0 Thread(s)
Quoted: 394 Post(s)
Liked 781 Times
in
377 Posts
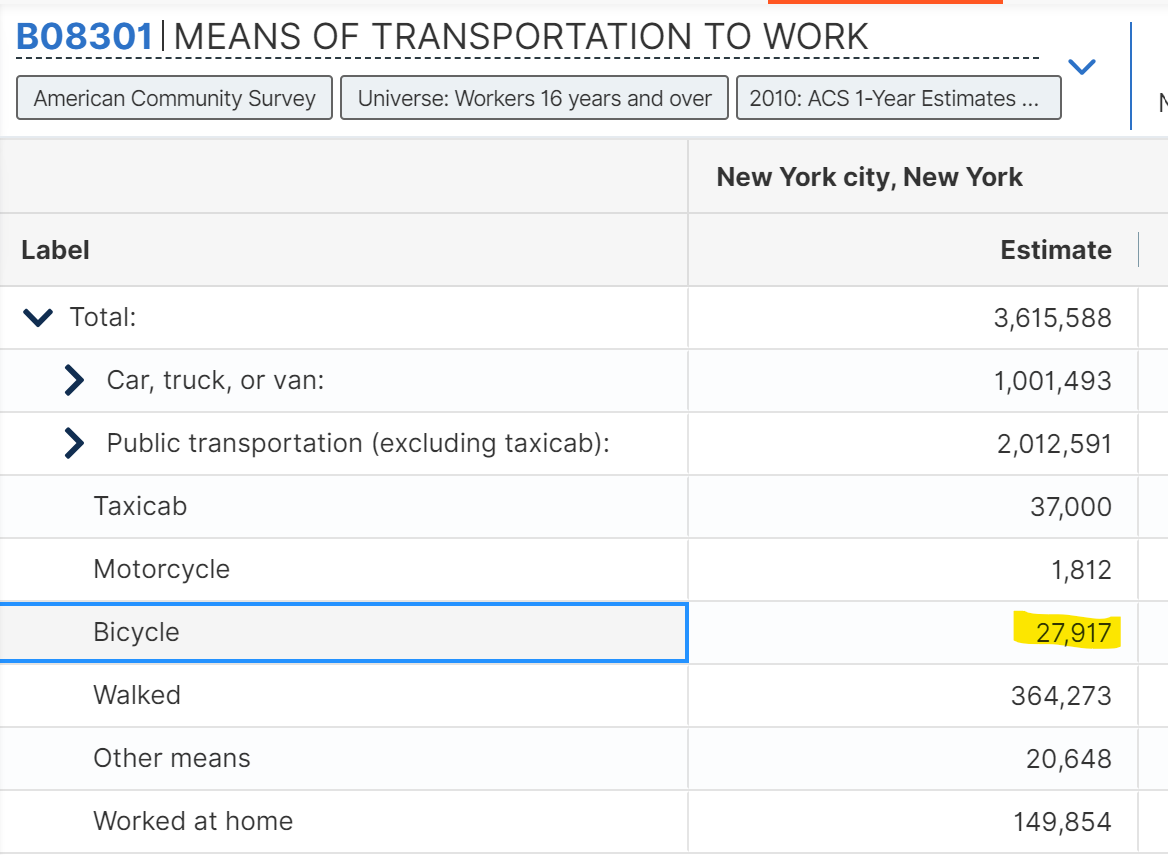
You need to work on your reading comprehension. Firstly, they used the Journey to Work data from the American Community Survey to determine what percentage of trips are commutes. Nowhere did they take the 536,000 number and multiply by 365. In fact, their 2017 estimate is based on 488,000 daily cycling trips, not 536,000 because they used a conservative estimate of 20%, not 18.2% from the NYS 2009 NHTS Comparison Report.
You are the only one multiplying 536,000 x 365. And you're wrong. And you won't admit it.
Because your assertion of 200M annual bicycle trips in 2015 is wrong for all the reasons stated above. Your whole argument is built on a house of cards and your unwillingness to have an honest discussion without resorting to passive aggressive ad hominem attacks is why I'm leaving this discussion and blocking you. It's a waste of time.
Apologies to all that have had to endure this.
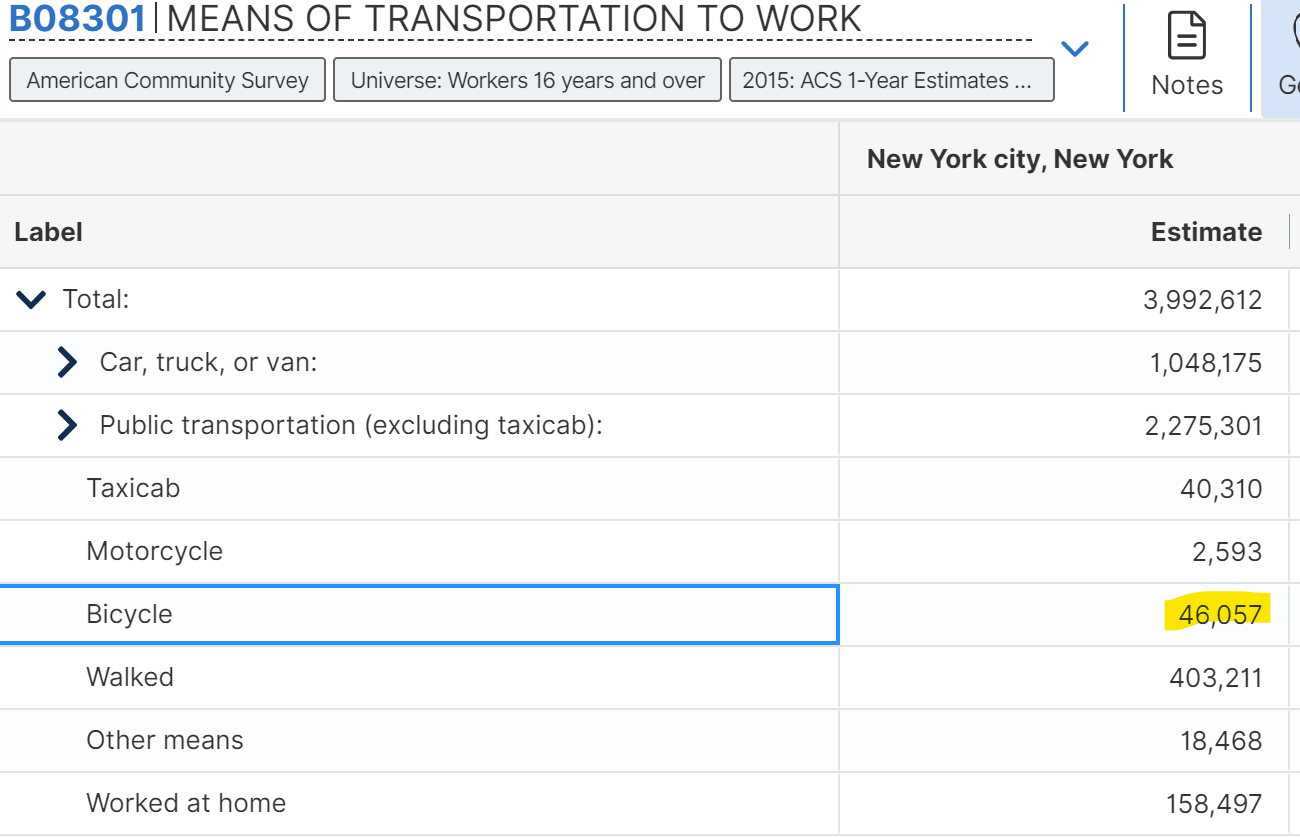
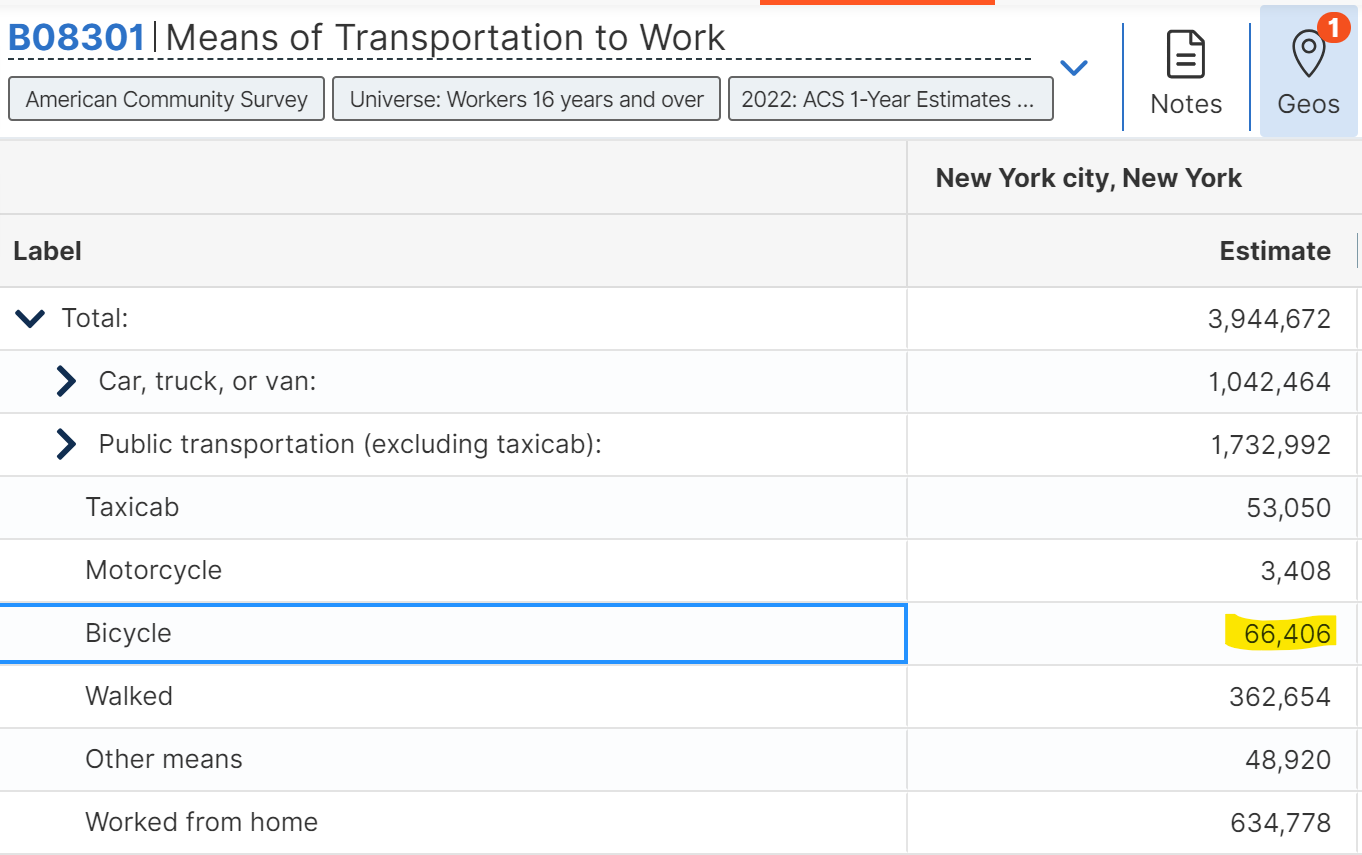
I'll end this with a couple of tables from the US Census American Community Survey that shows that from 2010 to 2022, over twice as many bicyclists are now commuting to work.
You are the only one multiplying 536,000 x 365. And you're wrong. And you won't admit it.
Finally, I note with interest that you declined to comment on the summary:
"Simplifying to wrap up, NYC hit about 200M annual bicycle trips in 2015 and had 14 fatalities, and 4896 injuries ( officially ). It reached about 220M trips last year, and had 18 fatalities, and 4949 injuries ( again, official count, not worth much ). ( All per NYC.gov bicycle crash data reports, and the aforementioned trip estimates. )"
"Simplifying to wrap up, NYC hit about 200M annual bicycle trips in 2015 and had 14 fatalities, and 4896 injuries ( officially ). It reached about 220M trips last year, and had 18 fatalities, and 4949 injuries ( again, official count, not worth much ). ( All per NYC.gov bicycle crash data reports, and the aforementioned trip estimates. )"
Apologies to all that have had to endure this.
I'll end this with a couple of tables from the US Census American Community Survey that shows that from 2010 to 2022, over twice as many bicyclists are now commuting to work.
11-26-23, 08:59 PM
#82
Full Member
I'm not either, to be honest, but city-level data is not easy to find. Another one is:
Again, not impressive ( although very good for pedestrians ).
Most of Irvine's vaunted "infrastructure" isn't really that impressive, it's mostly just unprotected bike lanes. "There are 355 miles of bike paths, 54 miles off-street and 301 miles on-street." (ibid) "85 percent of Irvine�s 355-mile bikeway network is on city streets, where bicyclists ride alongside high-speed vehicular traffic with a six-inch bike lane stripe that disappears at intersections as the only buffer." (ibid)
And residents don't actually bike all that much -- "However, community input indicates that the levels of active transportation activity remain relatively low due to concern over traffic speeds, challenging pedestrian crossings,and large, auto-oriented intersections." (ibid)
So, no, not Irvine.
Originally Posted by https://alfresco.cityofirvine.org/alfresco/guestDownload/direct?path=/Company%20Home/Shared/PW/Active%20Transportation%20Plan/IrvineATP%20TW%20-%20Final.pdf
From 2008 to 2012, there were 293 bicycle-related collisions in Irvine, an average of 58.6 bicycle-related collisions per year. During the same period, 194 pedestrian-related collisions occurred,
an average of 38.8 pedestrian-related collisions per year. The California Office of Traffic Safety (OTS) provides statistics for victim and collision rankings based on rates of victims killed and injured per �1,000 daily-vehicle-miles-of-travel� (Caltrans data) and per �1,000 average population� (Department of Finance) figures. The most recent ranking data is for collisions during 2011. The rankings for Irvine are based on 55 California cities (in its size category) with first position being the worst ranking. Out of 55 California cities, Irvine ranked 38th based on vehicle miles traveled and 28th based on average population for bicycle collisions. For pedestrian collisions, Irvine ranked 53rd based on vehicle miles traveled and 54th based on average population.
an average of 38.8 pedestrian-related collisions per year. The California Office of Traffic Safety (OTS) provides statistics for victim and collision rankings based on rates of victims killed and injured per �1,000 daily-vehicle-miles-of-travel� (Caltrans data) and per �1,000 average population� (Department of Finance) figures. The most recent ranking data is for collisions during 2011. The rankings for Irvine are based on 55 California cities (in its size category) with first position being the worst ranking. Out of 55 California cities, Irvine ranked 38th based on vehicle miles traveled and 28th based on average population for bicycle collisions. For pedestrian collisions, Irvine ranked 53rd based on vehicle miles traveled and 54th based on average population.
Most of Irvine's vaunted "infrastructure" isn't really that impressive, it's mostly just unprotected bike lanes. "There are 355 miles of bike paths, 54 miles off-street and 301 miles on-street." (ibid) "85 percent of Irvine�s 355-mile bikeway network is on city streets, where bicyclists ride alongside high-speed vehicular traffic with a six-inch bike lane stripe that disappears at intersections as the only buffer." (ibid)
And residents don't actually bike all that much -- "However, community input indicates that the levels of active transportation activity remain relatively low due to concern over traffic speeds, challenging pedestrian crossings,and large, auto-oriented intersections." (ibid)
So, no, not Irvine.
11-26-23, 08:59 PM
#83
Senior Member
Join Date: Jul 2009
Posts: 5,950
Bikes: Colnago, Van Dessel, Factor, Cervelo, Ritchey
Mentioned: 5 Post(s)
Tagged: 0 Thread(s)
Quoted: 3952 Post(s)
Liked 7,299 Times
in
2,947 Posts
Likes For tomato coupe:
11-26-23, 09:11 PM
#84
Full Member
You need to work on your reading comprehension. Firstly, they used the Journey to Work data from the American Community Survey to determine what percentage of trips are commutes. Nowhere did they take the 536,000 number and multiply by 365. In fact, their 2017 estimate is based on 488,000 daily cycling trips, not 536,000 because they used a conservative estimate of 20%, not 18.2% from the NYS 2009 NHTS Comparison Report.
You are the only one multiplying 536,000 x 365. And you're wrong. And you won't admit it.
You are the only one multiplying 536,000 x 365. And you're wrong. And you won't admit it.
Last year Was Deadliest on NYC Streets in Nearly a Decade in case anyone cares about reality, as it directly contrasts John's wishful imagination.
Last edited by TC1; 11-26-23 at 09:25 PM. Reason: added last link
11-27-23, 06:10 AM
#85
Senior Member
Join Date: May 2021
Posts: 8,442
Mentioned: 12 Post(s)
Tagged: 0 Thread(s)
Quoted: 4414 Post(s)
Liked 4,867 Times
in
3,012 Posts
The best local town/city I can think of for relatively safe cycling is Milton Keynes (UK). They have 200 miles of purpose built bike paths (Redways) criss-crossing the city and wider area. I haven't ridden there for a few years, so can't comment on e-bike use, but I would imagine there are loads of them.
11-27-23, 11:43 AM
#86
Full Member
The best local town/city I can think of for relatively safe cycling is Milton Keynes (UK). They have 200 miles of purpose built bike paths (Redways) criss-crossing the city and wider area. I haven't ridden there for a few years, so can't comment on e-bike use, but I would imagine there are loads of them.
Another analysis of Milton Keynes contains the following interesting section:
Originally Posted by https://www.cyclecraft.co.uk/digest/2decades.html
It is known that many accidents involving cyclists are not reported to the Police, but this is especially the case for accidents that occur on cycle paths where fewer than 3 per cent of accidents are believed to be reported (Ref 5). In particular, accidents that do not involve a motor vehicle are rarely recorded even when serious.
In Milton Keynes this situation has been aggravated by a frequent unwillingness on the part of the Police to accept accident reports from cyclists, especially when off-road. One fatality to a cyclist was not recorded as a cycling accident.
Notwithstanding these shortcomings, the Stats 19 statistics have recorded a considerable number of Redway injuries over the years. Table 1 lists the comparative accident performance of Redways, local roads and grid roads in the new town area. Year Grid road Local road Redway 1988 13 (2) 22 (5) 13 (3) 1989 19 (2) 18 (3) 13 (3) 1990 26 (7) 13 (1) 18 (1) 1991 15 (2) 12 (0) 9 (1) 1992 12 (1) 19 (0) 17 (1) 1993 13 (1) 24 (1) 13 (1) 1994 25 (1) 16 (1) 24 (4) 1995 13 (1) 20 (0) 26 (6) 1996 16 (2) 21 (1) 10 (0) 1997 20 (3) 23 (1) 28 (4) Table 1
Cyclist accidents 1988 - 1997
(Serious and fatal in brackets)
Stats 19
There have been as many, or more, serious accidents on Redways as on grid roads in five of the past 10 years, and more than on local roads in four years.
So we find, hopefully to no one's surprise at this point, that dedicated cycling infrastructure did not work to improve safety in Milton Keynes either -- and we can add it to the list of literally every single municipality that has attempted such a strategy.
11-27-23, 12:29 PM
#87
Senior Member

What a silly debate. Ofc cycling infrastructure and separating cyclists from motor vehicles improves cycling safety, although I'm sure lots of dedicated cycling infrastructure half a**ed to the extent of being meaningless. Ppl wont get on a bike in the first place, if its not there either.
I live in Copenhagen, Denmark. A city that has lots of good cycling infrastructure and MANY cyclists. If it wasn't there I wouldn't dare cycling in the city at all or would have to find quieter backroads, - or buy a car that I currently doesn't own or desperately need.
I live in Copenhagen, Denmark. A city that has lots of good cycling infrastructure and MANY cyclists. If it wasn't there I wouldn't dare cycling in the city at all or would have to find quieter backroads, - or buy a car that I currently doesn't own or desperately need.
Likes For Racing Dan:
11-27-23, 01:07 PM
#88
Senior Member
Join Date: May 2021
Posts: 8,442
Mentioned: 12 Post(s)
Tagged: 0 Thread(s)
Quoted: 4414 Post(s)
Liked 4,867 Times
in
3,012 Posts
As it happens, there is a very in-depth article extant on those Redways -- and why "separate but equal" infrastructure never is, and why it doesn't work.
Another analysis of Milton Keynes contains the following interesting section:
So we find, hopefully to no one's surprise at this point, that dedicated cycling infrastructure did not work to improve safety in Milton Keynes either -- and we can add it to the list of literally every single municipality that has attempted such a strategy.
One thing you can say for sure about MK is that without the Redways it would be a horrible place to cycle. But the Redways make cycling a far more attractive proposition and I think that is reflected in the large cycling community there.
Likes For PeteHski:
11-27-23, 01:38 PM
#89
Full Member
What a silly debate. Ofc cycling infrastructure and separating cyclists from motor vehicles improves cycling safety, although I'm sure lots of dedicated cycling infrastructure half a**ed to the extent of being meaningless. Ppl wont get on a bike in the first place, if its not there either.
Despite that, Copenhagen averages 3 cyclists killed annually for the past decade, which doesn't compare favorably with, for example, an American city like Chicago -- which has about 5 times the population, around twice as many cyclists, about seven times the land area, and averages about 6 cyclist fatalities annually.
11-27-23, 01:43 PM
#90
Senior Member
Join Date: Jul 2009
Posts: 5,950
Bikes: Colnago, Van Dessel, Factor, Cervelo, Ritchey
Mentioned: 5 Post(s)
Tagged: 0 Thread(s)
Quoted: 3952 Post(s)
Liked 7,299 Times
in
2,947 Posts
11-27-23, 01:50 PM
#91
Full Member
Well good, maybe some learning is taking place here after all.
Can you explain why your claim is directly refuted by the survey referenced?
This is already directed refuted by the first of my two original citations regarding Milton Keynes -- MK does not have greater cycling uptake than average.
Again, both claims are directed refuted by the evidence at-hand.
I understand that you all want to believe that your beloved infrastructure works. It makes you feel safer, and everyone wants to feel safe -- except for freeclimbers and a few others categories of nutjobs. That's a natural inclination. But when you allow your natural inclination to blind you to decades of unmistakable proof that such infrastructure does not work, and wastes time, money, and lives, you are no longer acting in the best interest of cyclists. I think many of you need to seriously reconsider your position with regard to cyclist safety, and ask yourselves why you are actively working against it.
Originally Posted by https://www.cyclecraft.co.uk/digest/2decades.html
In 1993 a survey (Ref 8) asked cyclists about their accident experience in the previous year. The great majority of respondents were adults, so this section may be more indicative of adult experience than that of children.
Overall 27 per cent of respondents had suffered an injury accident on a Redway, against 6 per cent on local roads and just 3 per cent on grid roads. Damage-only crashes were also more common on Redways, with 25 cases reported against one on a grid road and none on local roads.
It might be thought that the relatively low accident rate for grid roads is because few cyclists use them and those who do so are relatively experienced. The survey suggests otherwise, as 43 per cent of respondents said that they cycle on grid roads at least once a week. It must be assumed, therefore, that these roads are regularly used by cyclists of average skill, a viewpoint confirmed by casual observation.
This survey also attempted to relate accident risk to exposure. Cyclists were asked to estimate the distance they cycle in a week on each of the three kinds of highway. Inevitably there will be a wide margin of error in these estimates, but there is no reason to believe that they favour one type of highway over another. Some cyclists were able to give a very detailed breakdown of their mileage.
Based on distance cycled and accidents suffered, Table 4 shows the relative accident performance of each type of highway, normalised in terms of accidents per million kilometres cycled.
Highway Injury accidents All accidents Grid road 31 47 Local road 149 149 Redway 166 319 Table 4
Accidents per 106 km cycled
1993 survey of cyclists
Note: These figures are amended from those
published in Traffic Engineering + ControlThis suggests that a cyclist is more than twice as likely to suffer an accident on a Redway than on an local road, with the grid roads being the least hazardous type of highway relative to distance cycled by a wide margin. Applying the same distribution criteria to the known record of fatal accidents, a cyclist is more than twice as likely to be killed whilst using a Redway as when using a grid road.
Originally Posted by https://www.cyclecraft.co.uk/digest/2decades.html
MK was designed like this from the start and has resulted in a more cycle friendly culture than other neighbouring towns like Northampton, where I would imagine there are far fewer cyclists and yet more cycling fatalities. I haven�t checked the stats, but I�m sure you could.
Originally Posted by https://www.cyclecraft.co.uk/digest/2decades.html
One thing you can say for sure about MK is that without the Redways it would be a horrible place to cycle. But the Redways make cycling a far more attractive proposition and I think that is reflected in the large cycling community there.
I understand that you all want to believe that your beloved infrastructure works. It makes you feel safer, and everyone wants to feel safe -- except for freeclimbers and a few others categories of nutjobs. That's a natural inclination. But when you allow your natural inclination to blind you to decades of unmistakable proof that such infrastructure does not work, and wastes time, money, and lives, you are no longer acting in the best interest of cyclists. I think many of you need to seriously reconsider your position with regard to cyclist safety, and ask yourselves why you are actively working against it.
11-27-23, 01:51 PM
#92
Expired Member

Join Date: Jun 2007
Location: TN
Posts: 11,547
Mentioned: 37 Post(s)
Tagged: 0 Thread(s)
Quoted: 3674 Post(s)
Liked 5,437 Times
in
2,763 Posts
 IIRC that was established the last time he acted up.
11-27-23, 02:00 PM
IIRC that was established the last time he acted up.
11-27-23, 02:00 PM
#93
Full Member
A few people -- who I will credit at least for making an attempt -- have tried. No one has succeeded. This is not a new development -- as I mentioned, I've made this challenge before, to other groups. No one has found one yet. If dedicated cycling infrastructure actually worked, this challenge would be trivial to win. And yet, as shown here, and not for the first time, it is anything but winnable for your side.
Can you explain why, if such infrastructure works, why it is so incredibly hard for y'all to find even one example of such?
Can you explain why, since it doesn't work, we should continue to waste time, money, and lives pouring trillions of gallons and paint and concrete, which have no positive effect, instead of pursuing other strategies that do work?
Or, are you just going to stick with pathetic little snide comments that add nothing to the discussion?
11-27-23, 02:01 PM
#94
Full Member
11-27-23, 02:01 PM
#95
Senior Member
Join Date: May 2021
Posts: 8,442
Mentioned: 12 Post(s)
Tagged: 0 Thread(s)
Quoted: 4414 Post(s)
Liked 4,867 Times
in
3,012 Posts
I understand that you all want to believe that your beloved infrastructure works. It makes you feel safer, and everyone wants to feel safe -- except for freeclimbers and a few others categories of nutjobs. That's a natural inclination. But when you allow your natural inclination to blind you to decades of unmistakable proof that such infrastructure does not work, and wastes time, money, and lives, you are no longer acting in the best interest of cyclists. I think many of you need to seriously reconsider your position with regard to cyclist safety, and ask yourselves why you are actively working against it.
The fundamental problem with cycling in many places is that most people are simply not interested in cycling. But for those that are, bike paths like the ones in MK are a far better proposition than the local roads. I've ridden around them enough times to make my own conclusions. But as you have proved there is always someone or some group that will complain about anything. For example there are people who actually write to complain that the MK bike paths are not all straight grid lines.
11-27-23, 02:14 PM
#96
Full Member
Imagine that you were the only cyclist in your country, and everyone else was "simply not interested" in cycling. But also imagine that self-driving vehicle technology was sufficiently developed as to make it impossible for a motor vehicle to strike a cyclist. Would the fact that no one else cared about cycling be "the fundamental problem"? No. You could ride anywhere in perfect safety ( well, unless you ran into a tree ).
I've ridden around them enough times to make my own conclusions. But as you have proved there is always someone or some group that will complain about anything. For example there are people who actually write to complain that the MK bike paths are not all straight grid lines.
11-27-23, 02:30 PM
#97
Senior Member
Why would I stop? I have offered a challenge to this estimable group. Find one municipality anywhere on this planet that has successfully saved cyclist lives via dedicated cycling infrastructure construction.
A few people -- who I will credit at least for making an attempt -- have tried. No one has succeeded. This is not a new development -- as I mentioned, I've made this challenge before, to other groups. No one has found one yet. If dedicated cycling infrastructure actually worked, this challenge would be trivial to win. And yet, as shown here, and not for the first time, it is anything but winnable for your side.
Can you explain why, if such infrastructure works, why it is so incredibly hard for y'all to find even one example of such?
Can you explain why, since it doesn't work, we should continue to waste time, money, and lives pouring trillions of gallons and paint and concrete, which have no positive effect, instead of pursuing other strategies that do work?
Or, are you just going to stick with pathetic little snide comments that add nothing to the discussion?
(cant be bothered digging for statistics that I'm sure you'll insta-reject and counter with more frivolous comparisons and stats)
-> Everybody, Stay safe and wear a helmet (even if you can statistically "prove" helmets are a scam, made up by tree huggers and George Soros! ... haha
 11-27-23, 02:43 PM
#98
Full Member
But who wants that, right? Let's instead continue to throw away time, money, and lives on construction that has never worked yet, anywhere on the planet.
The pride in ignorance exhibited by many here is alarming, and sad. I did not expect to find that bikeforums.net was a harbor for so much of the internet's anti-intellectualism and anti-education sentiment.
11-27-23, 02:47 PM
#99
Expired Member
Join Date: Jun 2007
Location: TN
Posts: 11,547
Mentioned: 37 Post(s)
Tagged: 0 Thread(s)
Quoted: 3674 Post(s)
Liked 5,437 Times
in
2,763 Posts
Are you now saying you do ride a bike some significant amount? I'm not going to search prior threads and I did say "IIRC." Happy to be corrected if I'm wrong.
11-27-23, 02:51 PM
#100
Full Member
And, by the way, when you check a person's profile here, that person can see that you did so -- and I can see that you did check my profile history a while ago. So that's two lies, in one little comment. I'm going to suggest you return to the quiet part of the peanut gallery now, as this isn't going well for you.
Last edited by TC1; 11-27-23 at 02:57 PM. Reason: adding recommendation