


Modeling the training impulse and the limitations of the performance manager.
 04-17-07 | 11:53 PM
#1
Thread Starter
Killing Rabbits
Joined: Apr 2005
Posts: 5,696
Likes: 217
Modeling the training impulse and the limitations of the performance manager.
The recent fascination in terms like TSS, ACL, and CTL has increased my curiosity of where these terms originated and the science supporting them. Cursory investigations lead me to the training impulse model of Banister (TRIMP), which was later adapted and adulterated by Coggan.
The training impulse model of Bannister:
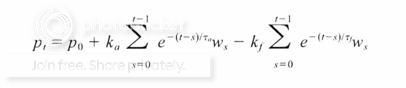
Bannister originally measured the daily training workload (Ws) based on time (T) spent in 5 zones based on %MHR
Ws = 1(Tz1) + 2(Tz2) + 3(Tz3) + 4(Tz4) + 5(Tz5)
Coggan�s first modification was in the way that the workload (Ws) is quantified, using
Ws = T(IF)
IF = Pnorm/Pft
This modification has both advantages and disadvantages. Its primary advantage is that it scores the intensity of the workout relative to a measurable performance parameter that can be adjusted, rather than an arbitrary % of MHR. However, this can also become a disadvantage, as certainly not all metabolic demands are attenuated just because someone becomes very fit. For example, do you think your liver and kidneys etc get �stronger� at the same rate as your LT rises? Maybe to some organs a watt is a watt (or kcal), even if your legs don�t burn anymore. Bannister accepted this limitation but it was more an acceptance that athletes can only endure so much (a maximal but very large trimp), not that it becomes easier (same TSS scores because LT testing results rose), but I digress. Especially considering that all parties seem to agree that the metric used is irrelevant.
The model appears to work equally well regardless of precisely how training has been quantified. (1)
It quickly occurred to me that the arbitrary 7-day moving average for ACL and 42-day moving average for CTL was an unsatisfactory approximation. Furthermore, fitting the model of Banister in a common home spreadsheet program such as MS excel was not as hard as the power 411 might suggest.
Given the relative complexity of the impulse-response model (at least from the perspective of most non-scientists) and the limitations discussed above, many are tempted to simply dismiss the approach out-of-hand as unbelievable �black magic�, or at the very least, as too unpractical for routine use.
The problem, however, is how to do so in a manner that is consistent with the results of this previous scientific research, yet is still simple enough to be used and applied in a real-world setting.(1)
I always try to learn from champions�
�Things should be made as simple as possible, but not any simpler." �Albert Einstein.
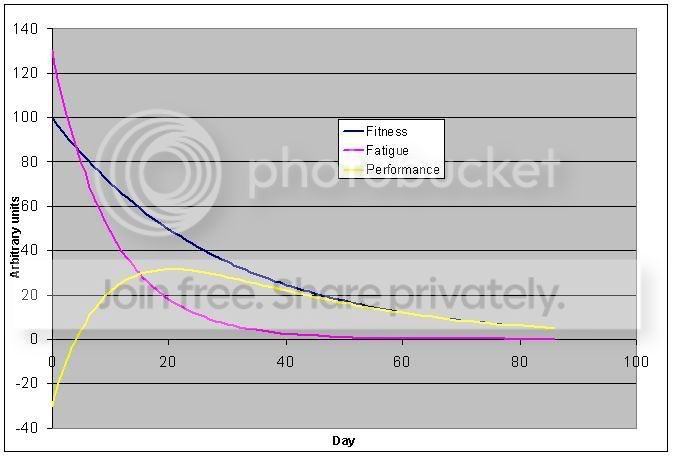
Now here comes the real fun, fitting the decay constants to the training impulse model and comparing the result to the ridiculous approximations the performance manger goes on to make. Personally, I have found that the model constants that most closely match my sensations of fatigue and performance levels are ta: 29.5 tf: 10.5 k1/k2: 1.3 and is shown graphically below (note: this is not the example plot they give you in the power 411).
Now lets demonstrate how the models react to 2 scenarios; in both cases we will define Ws=TSS to make comparisons easier. Ok, two perfectly matched imaginary clients begin cycling training using equal training-volume programs (weekly TSS) with the only alteration being the workout frequency and duration. While both �athletes� will be doing 480TSS of exercise each week, one will do it split up into 6x80TSS and the other will do it in two hard days (2x240TSS). So one has 6 small impulses and the other 2 large impulses. After both functions achieve a steady state the imaginary client completely ceases all training (like a crappy taper). Lets see the results.
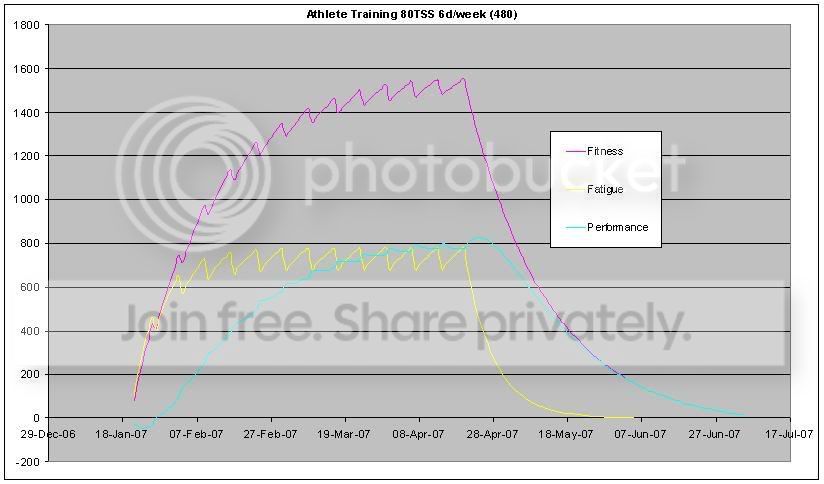
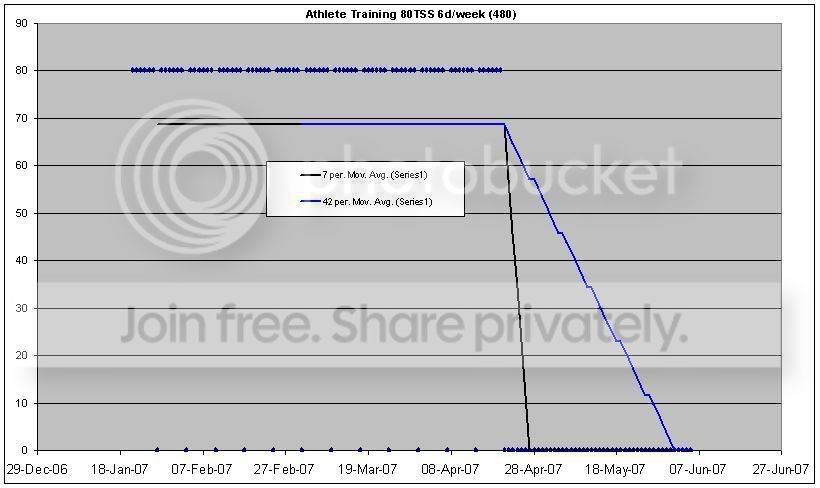
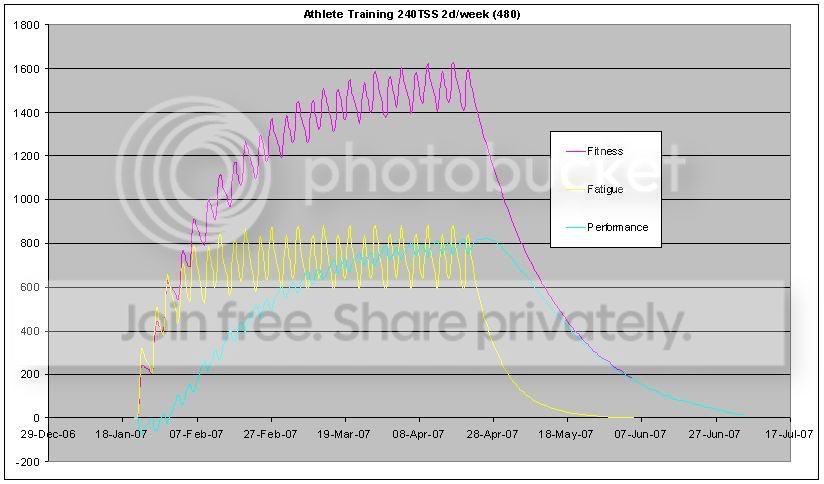
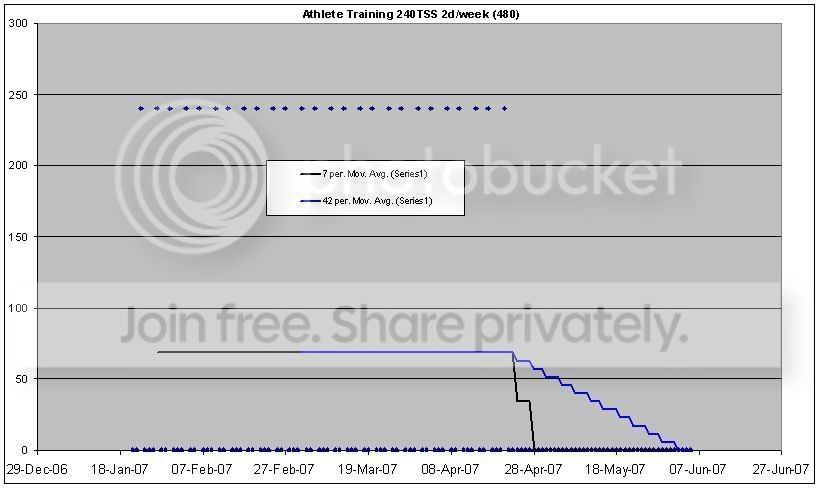
The Bannister model (using the constants I mentioned above) provides a nice illustration of how ones fatigue levels would vary during the training week and may even provide a way of determining a fatigue breakpoint where illness ensues. For example one may find that if they break 2000 imaginary fatigue units they get an infection or overuse injury. The moving average system is not sensitive enough to show much.
The Bannister model also predicts the taper performance maximum quite nicely when compared with user reports (1 week tapers work). Make your own conclusions.
Always, always, always read the source material!
(1) https://www.cyclingpeakssoftware.com/...gerscience.asp
The training impulse model of Bannister:
Bannister originally measured the daily training workload (Ws) based on time (T) spent in 5 zones based on %MHR
Ws = 1(Tz1) + 2(Tz2) + 3(Tz3) + 4(Tz4) + 5(Tz5)
Coggan�s first modification was in the way that the workload (Ws) is quantified, using
Ws = T(IF)
IF = Pnorm/Pft
This modification has both advantages and disadvantages. Its primary advantage is that it scores the intensity of the workout relative to a measurable performance parameter that can be adjusted, rather than an arbitrary % of MHR. However, this can also become a disadvantage, as certainly not all metabolic demands are attenuated just because someone becomes very fit. For example, do you think your liver and kidneys etc get �stronger� at the same rate as your LT rises? Maybe to some organs a watt is a watt (or kcal), even if your legs don�t burn anymore. Bannister accepted this limitation but it was more an acceptance that athletes can only endure so much (a maximal but very large trimp), not that it becomes easier (same TSS scores because LT testing results rose), but I digress. Especially considering that all parties seem to agree that the metric used is irrelevant.
The model appears to work equally well regardless of precisely how training has been quantified. (1)
It quickly occurred to me that the arbitrary 7-day moving average for ACL and 42-day moving average for CTL was an unsatisfactory approximation. Furthermore, fitting the model of Banister in a common home spreadsheet program such as MS excel was not as hard as the power 411 might suggest.
Given the relative complexity of the impulse-response model (at least from the perspective of most non-scientists) and the limitations discussed above, many are tempted to simply dismiss the approach out-of-hand as unbelievable �black magic�, or at the very least, as too unpractical for routine use.
The problem, however, is how to do so in a manner that is consistent with the results of this previous scientific research, yet is still simple enough to be used and applied in a real-world setting.(1)
I always try to learn from champions�
�Things should be made as simple as possible, but not any simpler." �Albert Einstein.
Now here comes the real fun, fitting the decay constants to the training impulse model and comparing the result to the ridiculous approximations the performance manger goes on to make. Personally, I have found that the model constants that most closely match my sensations of fatigue and performance levels are ta: 29.5 tf: 10.5 k1/k2: 1.3 and is shown graphically below (note: this is not the example plot they give you in the power 411).
Now lets demonstrate how the models react to 2 scenarios; in both cases we will define Ws=TSS to make comparisons easier. Ok, two perfectly matched imaginary clients begin cycling training using equal training-volume programs (weekly TSS) with the only alteration being the workout frequency and duration. While both �athletes� will be doing 480TSS of exercise each week, one will do it split up into 6x80TSS and the other will do it in two hard days (2x240TSS). So one has 6 small impulses and the other 2 large impulses. After both functions achieve a steady state the imaginary client completely ceases all training (like a crappy taper). Lets see the results.
The Bannister model (using the constants I mentioned above) provides a nice illustration of how ones fatigue levels would vary during the training week and may even provide a way of determining a fatigue breakpoint where illness ensues. For example one may find that if they break 2000 imaginary fatigue units they get an infection or overuse injury. The moving average system is not sensitive enough to show much.
The Bannister model also predicts the taper performance maximum quite nicely when compared with user reports (1 week tapers work). Make your own conclusions.
Always, always, always read the source material!
(1) https://www.cyclingpeakssoftware.com/...gerscience.asp
 04-18-07 | 12:58 AM
#3

部門ニ/自転車オタク
Joined: Dec 2005
Posts: 3,173
Likes: 0
From: Sterling, VA
Bikes: 2008 Blue T16, 2009 Blue RC8, 2012 Blue Norcross CX, 2016 Blue Axino SL, 2016 Scott Scale, Fixie, Fetish Cycles Road Bike (on the trainer)
As an aside, I track both a 7 day and 28 day TSS average and the PMC cumulative, but exponentially increased average. I have marks along side my 7 day TSS scores where I "really" felt worked out and unable to perform at the desired intensities. I don't really have a 28 day "mark" I suppose.
Dec 24th, 2006 I took an unscheduled day off. I ended a week at 180 tss/day. (I readjusted FTP on Christmas day, so this was probably a little high. I'd spent the whole week over 150 tss/day) I was pooped
March 25th, 2007 I was at 168.86 TSS/day. I couldn't complete my interval workout on the following Tuesday (after a rest day), and wasn't back "on form" until Thursday when my 7 day mark was in the 140's again.
My "good line" seems to be right around 115 TSS/day fatigue. More than that and I don't seem to do well. My best times have been at less than 115 TSS/day 7 day average.
This is the PMC I use for personal analysis.
__________________
Envision, Energize, Enable
Envision, Energize, Enable
04-18-07 | 06:31 AM
#4


pan y agua

Joined: Aug 2005
Posts: 31,809
Likes: 1,232
From: Jacksonville
Bikes: Willier Zero 7; Merlin Extralight; Calfee Dragonfly tandem, Calfee Adventure tandem; Cervelo P2; Motebecane Ti Fly 29er; Motebecanne Phantom Cross; Schwinn Paramount Track bike
l'anglais s'il vous pla�t
04-18-07 | 06:38 AM
#5

Carpe Diem
Joined: Sep 2006
Posts: 13,149
Likes: 1
From: MABRA
Bikes: 2007 CAAD9; 2014 CAADX; PedalForce CG1
enthalpic, mind if I post this on the Wattage forums (where Allen and Coggan are regulars)?
__________________
"When you are chewing the bars at the business end of a 90 mile road race you really dont care what gear you have hanging from your bike so long as it works."
ΛΧΑ ΔΞ179 - 15% off your first Hammer Nutrition order!
"When you are chewing the bars at the business end of a 90 mile road race you really dont care what gear you have hanging from your bike so long as it works."
ΛΧΑ ΔΞ179 - 15% off your first Hammer Nutrition order!
 04-18-07 | 06:59 AM
#7
部門ニ/自転車オタク
Joined: Dec 2005
Posts: 3,173
Likes: 0
From: Sterling, VA
Bikes: 2008 Blue T16, 2009 Blue RC8, 2012 Blue Norcross CX, 2016 Blue Axino SL, 2016 Scott Scale, Fixie, Fetish Cycles Road Bike (on the trainer)
I would also add that Coggan recently presented on the comparison of systems and determined (though I would admit - likely biasedly so) that TSS is most representative way to quantify training load.
Wattage group on google under the title: "Quantifying training load"
based on this presentation: https://www.cyclecoach.com/andycoggan...d/uksport1.ppt
Wattage group on google under the title: "Quantifying training load"
based on this presentation: https://www.cyclecoach.com/andycoggan...d/uksport1.ppt
__________________
Envision, Energize, Enable
Envision, Energize, Enable
04-18-07 | 08:53 AM
#8
Thread Starter
Killing Rabbits
Joined: Apr 2005
Posts: 5,696
Likes: 217
Originally Posted by bdcheung
enthalpic, mind if I post this on the Wattage forums (where Allen and Coggan are regulars)?
Last edited by Enthalpic; 11-03-07 at 11:29 PM.
04-18-07 | 09:36 AM
#9
Senior Member
Joined: Dec 2005
Posts: 525
Likes: 0
Originally Posted by NomadVW
As an aside, I track both a 7 day and 28 day TSS average and the PMC cumulative, but exponentially increased average. I have marks along side my 7 day TSS scores where I "really" felt worked out and unable to perform at the desired intensities. I don't really have a 28 day "mark" I suppose.
Dec 24th, 2006 I took an unscheduled day off. I ended a week at 180 tss/day. (I readjusted FTP on Christmas day, so this was probably a little high. I'd spent the whole week over 150 tss/day) I was pooped
March 25th, 2007 I was at 168.86 TSS/day. I couldn't complete my interval workout on the following Tuesday (after a rest day), and wasn't back "on form" until Thursday when my 7 day mark was in the 140's again.
My "good line" seems to be right around 115 TSS/day fatigue. More than that and I don't seem to do well. My best times have been at less than 115 TSS/day 7 day average.
This is the PMC I use for personal analysis.
Dec 24th, 2006 I took an unscheduled day off. I ended a week at 180 tss/day. (I readjusted FTP on Christmas day, so this was probably a little high. I'd spent the whole week over 150 tss/day) I was pooped
March 25th, 2007 I was at 168.86 TSS/day. I couldn't complete my interval workout on the following Tuesday (after a rest day), and wasn't back "on form" until Thursday when my 7 day mark was in the 140's again.
My "good line" seems to be right around 115 TSS/day fatigue. More than that and I don't seem to do well. My best times have been at less than 115 TSS/day 7 day average.
This is the PMC I use for personal analysis.
thx
gene r
04-18-07 | 02:05 PM
#10
部門ニ/自転車オタク
Joined: Dec 2005
Posts: 3,173
Likes: 0
From: Sterling, VA
Bikes: 2008 Blue T16, 2009 Blue RC8, 2012 Blue Norcross CX, 2016 Blue Axino SL, 2016 Scott Scale, Fixie, Fetish Cycles Road Bike (on the trainer)
I am using an excel spreadsheet.
__________________
Envision, Energize, Enable
Envision, Energize, Enable
04-18-07 | 02:08 PM
#11

Used to be a climber..
Joined: Aug 2005
Posts: 7,067
Likes: 193
From: Tucson, AZ
Bikes: 2021 Merlin Sandstone, 2016 Ridley Fenix SL, 2020 Trek Emonda ALR (rim brake), Trek Roscoe 9
Originally Posted by BlessedHellride
I think my head just exploded.
__________________
2016 Trek 520 (54cm) touring bike for sale - never ridden. Message me for photos/details.
2016 Trek 520 (54cm) touring bike for sale - never ridden. Message me for photos/details.
04-18-07 | 02:19 PM
#12

Senior Member
Joined: Mar 2005
Posts: 3,159
Likes: 0
From: In the middle of horse country, in The Garden State
reading that made me feel like I was back in grad school. lol
11-02-07 | 12:04 PM
#13
Senior Member
Joined: Nov 2007
Posts: 91
Likes: 0
 ).
).Anyway, my only comment would be that, at least based on the graphs that you presented, you don't seem to understand how CTL and ATL are calculated. Specifically, they are not simple moving averages, as you have assumed/shown.
11-02-07 | 12:07 PM
#14

Dang, I need a fricken nap now.
11-02-07 | 12:17 PM
#16
Thread Starter
Killing Rabbits
Joined: Apr 2005
Posts: 5,696
Likes: 217
No need, I stumbled upon this thread today (which I apologize for dredging up again, but since you accused me of "adulterating" the impulse-response model and used other derogatory tersm, I figure that I'm allowed ).
Anyway, my only comment would be that, at least based on the graphs that you presented, you don't seem to understand how CTL and ATL are calculated. Specifically, they are not simple moving averages, as you have assumed/shown.
).Anyway, my only comment would be that, at least based on the graphs that you presented, you don't seem to understand how CTL and ATL are calculated. Specifically, they are not simple moving averages, as you have assumed/shown.
"The default time constants of the Performance Manager, i.e., 42 d (6 wk) for CTL and 7 d (1 wk) for ATL were chosen as nominal values based on the scientific literature."
11-02-07 | 12:19 PM
#17

base training heretic
Joined: Aug 2003
Posts: 716
Likes: 0
From: Denver, CO
Bikes: Cervelo P3C, many Litespeeds
No need, I stumbled upon this thread today (which I apologize for dredging up again, but since you accused me of "adulterating" the impulse-response model and used other derogatory tersm, I figure that I'm allowed ).
Anyway, my only comment would be that, at least based on the graphs that you presented, you don't seem to understand how CTL and ATL are calculated. Specifically, they are not simple moving averages, as you have assumed/shown.
).Anyway, my only comment would be that, at least based on the graphs that you presented, you don't seem to understand how CTL and ATL are calculated. Specifically, they are not simple moving averages, as you have assumed/shown.
What Enthalpic doesn't understand could fill a warehouse:
https://www.bikeforums.net/showpost.p...1&postcount=81
11-02-07 | 12:21 PM
#18
Thread Starter
Killing Rabbits
Joined: Apr 2005
Posts: 5,696
Likes: 217
Welcome to the hell that is bikeforums.net!
What Enthalpic doesn't understand could fill a warehouse:
https://www.bikeforums.net/showpost.p...1&postcount=81
What Enthalpic doesn't understand could fill a warehouse:
https://www.bikeforums.net/showpost.p...1&postcount=81
I don't think I have all the answers, that would hinder learning. I strive for continuous improvement; make me a believer in your system if you can. Right now I think T Noakes central governor theory is my favorite.
Last edited by Enthalpic; 11-02-07 at 12:37 PM.
 11-02-07 | 12:30 PM
#20
Senior Member
Joined: Nov 2007
Posts: 91
Likes: 0
As described in the article, CTL and ATL are calculated using exponentially-weighted moving averages, using default values for the time constants of 42 and 7 d, respectively. I can see how someone skimming through the text might miss this statement, but I don't know how anyone could look at all of the graphs I included and somehow think that they were calculated using a simple moving average (which doesn't have a time constant in the first place).
11-02-07 | 12:30 PM
#21
base training heretic
Joined: Aug 2003
Posts: 716
Likes: 0
From: Denver, CO
Bikes: Cervelo P3C, many Litespeeds
The idea that you can train for cycling by lifting weights and doing high cadence drills has provided some of us with months of laughs. But if you no longer believe that then it's not as funny anymore.
11-02-07 | 12:36 PM
#22
Thread Starter
Killing Rabbits
Joined: Apr 2005
Posts: 5,696
Likes: 217
As described in the article, CTL and ATL are calculated using exponentially-weighted moving averages, using default values for the time constants of 42 and 7 d, respectively. I can see how someone skimming through the text might miss this statement, but I don't know how anyone could look at all of the graphs I included and somehow think that they were calculated using a simple moving average (which doesn't have a time constant in the first place).
11-02-07 | 12:37 PM
#23
Senior Member
Joined: Nov 2007
Posts: 91
Likes: 0
I would also add that Coggan recently presented on the comparison of systems and determined (though I would admit - likely biasedly so) that TSS is most representative way to quantify training load.
Wattage group on google under the title: "Quantifying training load"
based on this presentation: https://www.cyclecoach.com/andycoggan...d/uksport1.ppt
Wattage group on google under the title: "Quantifying training load"
based on this presentation: https://www.cyclecoach.com/andycoggan...d/uksport1.ppt
 ): I drew no conclusions in that thread re. the best way of quantifying training load, and in fact during my talk to the coaches and sports scientists from UK Sport went out of my way to emphasize that I thought that "the answer" isn't to be found in inventing ever-better metrics for doing so.
11-02-07 | 12:41 PM
): I drew no conclusions in that thread re. the best way of quantifying training load, and in fact during my talk to the coaches and sports scientists from UK Sport went out of my way to emphasize that I thought that "the answer" isn't to be found in inventing ever-better metrics for doing so.
11-02-07 | 12:41 PM
#24
Senior Member
Joined: Nov 2007
Posts: 91
Likes: 0
Anyway, this Wikipedia entry describes how to calculate an exponentially-weighted moving average:
https://en.wikipedia.org/wiki/Weighte...moving_average
and you already know the default time constants, so it seems to me that you should be good to go...
11-02-07 | 01:00 PM
#25
Senior Member
Joined: Nov 2007
Posts: 91
Likes: 0
BTW, you might be able to save yourself some trouble by just taking a bit of time to study the graphs that I included in my write-up, in particular Fig. 2 and 3. They show (and I described) exactly what you attempted to illustrate, i.e., the similarities and differences between the impulse-response model and the Performance Manager approach when the input function changes in a square-wave manner (albeit as a step up, not as a step down as you modeled).