


Average elevation gain
 07-28-16 | 03:41 PM
#26
pluralis majestatis

Joined: Feb 2004
Posts: 4,206
Likes: 5
From: you rope
Bikes: a DuhRosa
 07-28-16 | 03:45 PM
#27
Senior Member
Joined: Mar 2010
Posts: 23,208
Likes: 10,653
From: Seattle, WA
07-28-16 | 04:09 PM
#28
Senior Member
Joined: Aug 2013
Posts: 1,597
Likes: 7
From: Houston, TX
Bikes: 2017 Cannondale CAAD12 105, 2014 Giant Escape City
07-28-16 | 04:13 PM
#29
Senior Member
Joined: Oct 2015
Posts: 1,493
Likes: 11
From: Middletown NY
Bikes: Cannondale SuperSix EVO w Hi-Mod frame, Raleigh Tamland 1 and Giant Anthem X

 07-28-16 | 08:57 PM
#34
Senior Member
Joined: May 2015
Posts: 1,003
Likes: 13
All hail the mighty Strava.
So far this month in the distance challenge: 247,394 riders have ridden a total of 116,947,484 km (472.71km or 293.73 miles per rider)
In the elevation challenge: 193,766 riders have climbed a total of 1,206,966,819 metres (6,228.99m or 20,436.35 ft per rider).
This works out to an average of 13.177 metres gained per km or 69.57 ft per mile.
So for a 20 mile ride the average elevation gain for all strava riders would be 1391.5 ft so you're a bit under that figure.
Now, how accurate is the elevation gains on Strava? Good question.
For fun, my average gain per mile this year is 72.60 ft and this is using a Garmin 500 GPS with altimeter data.
07-28-16 | 09:17 PM
#35


From the 2013 "Annual Pissing Contest" thread, so perhaps the higher mileage riders were more likely to report.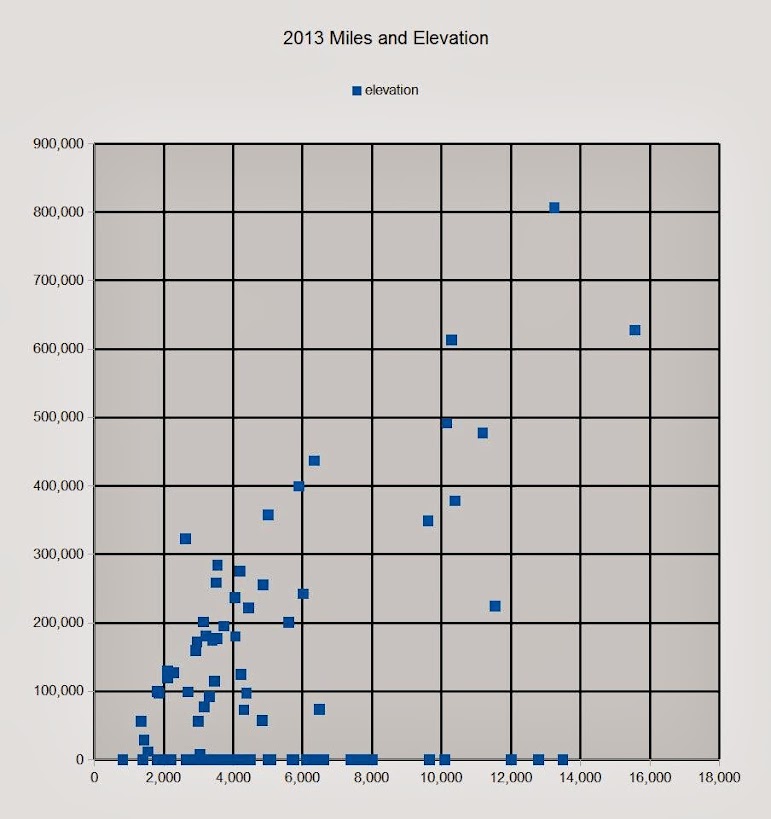
Here's the first 125 posts that mentioned their miles (or km*.62) and their feet (or meters*3.28). Reports of miles without feet are on the X axis.
I did this pretty quickly, so there may be a couple of bad data points.
There's more riders over 10,000 miles than I expected.
About 50 feet per mile over the whole season seems quite common. That's the 45 degree diagonal line from the 0,0 point. But the riders over 4,000 miles tend to be above that line, more like 60+ feet per mile.
The flattest territory award goes to fmy906, with 3,052 miles and 8,068 feet. Wow, 2.64 feet per mile! EDIT--he reports that 1100 feet of the 8000 were in one away ride!
Hilliest is robbyville, 3,546 and 284,311 feet. 80 feet per mile.
(The entry at about 2,500 miles with 325,000 feet is an error.)
Last edited by rm -rf; 07-28-16 at 09:22 PM.
07-28-16 | 09:24 PM
#36

The space coyote lied.


Joined: Sep 2008
Posts: 48,726
Likes: 10,984
From: dusk 'til dawn.
Bikes: everywhere
I am curious how hilly the average ride is for other recreational cyclists.
My usual road routes average around 20 miles with an elevation gain of around 800 ft.
I can ofc choose alternate routes that would be less hilly or more hilly but that seems to be where I have settled in.
I get my data from Strava and am also wondering how accurate it is concerning elevation?
My usual road routes average around 20 miles with an elevation gain of around 800 ft.
I can ofc choose alternate routes that would be less hilly or more hilly but that seems to be where I have settled in.
I get my data from Strava and am also wondering how accurate it is concerning elevation?

The steepest reading for the hill in Strava is 32.4%, so it works pretty good on that one. Some segments over bridges get really weird, however.
07-28-16 | 10:20 PM
#37
Senior Member
Joined: Apr 2012
Posts: 960
Likes: 94
From: Amateur Coachsurfer
California is amazing for climbing. I do not understand why would you get into cycling if you do not do climbs. Flats are the boring parts in between the ascents/descents.
07-28-16 | 11:27 PM
#39

In Real Life

Joined: Jan 2003
Posts: 52,159
Likes: 773
From: Down under down under
Bikes: Lots
I am curious how hilly the average ride is for other recreational cyclists.
My usual road routes average around 20 miles with an elevation gain of around 800 ft.
I can ofc choose alternate routes that would be less hilly or more hilly but that seems to be where I have settled in.
I get my data from Strava and am also wondering how accurate it is concerning elevation?
My usual road routes average around 20 miles with an elevation gain of around 800 ft.
I can ofc choose alternate routes that would be less hilly or more hilly but that seems to be where I have settled in.
I get my data from Strava and am also wondering how accurate it is concerning elevation?
First ... I do this calculation:
Metres of climbing/Kilometres of riding distance in metres * 100 to determine the difficulty level of a ride.
So for example, the ride we've got planned on the weekend has about 700 metres of climbing over 100 km. That's (700/100,000)*100 = 0.7
The century we did a couple weekends ago had about 1700 metres of climbing over 165 km. That's (1700/165,000)*100 = 1.03
And then I rank those numbers.
... if a ride is less than 0.5 ... it is a flat ride.
... if a ride is less than 1 ... it is a little bit hilly, but doable.
... if a ride is less than 1.5 ... it is a hilly ride and will be a bit of a struggle, but I can manage it. Just.
... if a ride is over 1.5 ... it's too hilly for me right now.
Most of our rides are somewhere around 1. It's challenging finding rides in this area that come in much less than that ... takes a bit of strategic planning to avoid the hills.
This calculation and rating system says nothing about the steepness of a particular hill or the distribution of the hills. For me, this just indicates whether or not I can do a ride within the 15 km/h time limit on randonnees.
As far as individual hills goes ... if it is under 10%, it's fine. I can do that without too much effort. If it is over 10%, it starts to become a struggle.
Second, regarding Strava ... I map the route using Google Maps and it comes up with an elevation number. Then we ride it and Strava comes up with an elevation number that is considerably higher. There's a chance the Google number is low. There's a chance the Strava number is high. The real number is likely somewhere in between.
Third, using the calculation above ... 20 miles is 32 km. 800 feet is 243 metres.
(243/32,000)*100 = 0.76
__________________
Rowan
My fave photo threads on BF
Century A Month Facebook Group
Machka's Website
Photo Gallery
Rowan
My fave photo threads on BF
Century A Month Facebook Group
Machka's Website
Photo Gallery
Last edited by Machka; 07-28-16 at 11:34 PM.
07-29-16 | 12:38 AM
#40
pluralis majestatis
Joined: Feb 2004
Posts: 4,206
Likes: 5
From: you rope
Bikes: a DuhRosa
Google's numbers are a bit high. Strava numbers are a lot high.
I go off baro-based altim from the Garmin that gets written by strava.
So when I'm using strava to map a ride intending for 800m gain, ill map until it shows 1200m.
I go off baro-based altim from the Garmin that gets written by strava.
So when I'm using strava to map a ride intending for 800m gain, ill map until it shows 1200m.
07-29-16 | 04:28 AM
#41
Senior Member
Joined: Jul 2006
Posts: 9,158
Likes: 1,743
From: Lebanon (Liberty Hill), CT
Bikes: Canyon Aeroad, CAAD 12, MASI Gran Criterium S, Colnago World Cup CX, Guru steel & Guru Photon
07-29-16 | 05:08 AM
#42

Senior Member
Joined: Aug 2014
Posts: 4,286
Likes: 1
So far this month in the distance challenge: 247,394 riders have ridden a total of 116,947,484 km (472.71km or 293.73 miles per rider)
In the elevation challenge: 193,766 riders have climbed a total of 1,206,966,819 metres (6,228.99m or 20,436.35 ft per rider).
This works out to an average of 13.177 metres gained per km or 69.57 ft per mile.
So for a 20 mile ride the average elevation gain for all strava riders would be 1391.5 ft....
Nice summary, but for folks who enter challenges, not so much a representative sample of all recreational cyclists, or even all Strava users.
For my part, VeloViewer has averages broken down by bike, which is kind of interesting.
"n/a," which is actually my first bike, shows averages of 19.9 miles with 440' gained, or about 22'/mile. I spent a lot of time on the Hudson River Greenway.

Once I got another bike and differentiated between the two, on the same bike it shows averages of 17 miles with 685', or 40.3'/mile, so rides got considerably "climby-er"
The FG bike shows a 32'/mile average.
On the "gran fondo" bike, days are often split, with rides to start and home from finish usually recorded separately, sometimes first and second half recorded separately, so the average distance is fairly short at about 24 miles, with an average elevation gain of 1305', so overall, 54.6'/mile average.
Edit/add for some VeloViewer bragstats:
Best month so far was May of last year: average elevation gain of 102'/mile, which included a day with 12,000' gained (incl. Passo Daone and Madonna di Campiglio), and another ride that averaged a massive 524'/mile for 12 1/2 miles (Cima Grappa), or a 9.9 on the Machka scale.
Last edited by kbarch; 07-30-16 at 10:04 AM.
08-02-16 | 12:32 PM
#43
Senior Member
Joined: Jul 2016
Posts: 105
Likes: 13
From: Reno, NV
Bikes: 2020 Specialized Roubaix Comp, 2019 Specialized Diverge Sport, 2018 Santa Cruz Bronson S Aluminum 27.5, 2014 Wabi Classic (Fixed)
Here in the East Bay, about 80-90 ft. per mile or if riding in the Sierras, about 100 ft. per mile. When I lived in Sacramento, about 10 ft. per mile.
08-02-16 | 12:48 PM
#45

Senior Member
Joined: Jul 2002
Posts: 40,863
Likes: 3,115
From: Sacramento, California, USA
Bikes: Specialized Tarmac, Canyon Exceed, Specialized Transition, Ellsworth Roots, Ridley Excalibur
08-02-16 | 02:35 PM
#48
Senior Member
Joined: Feb 2011
Posts: 530
Likes: 4
From: Northern CA
Bikes: Yes
This shouldn't be as hard as people are making it out to be. Look at your total distance and elevation. Divide by number of rides. If you have Veloviewer, it's right on the summary page.
Total Rides: 364
Avg. distance: 34.5 miles
Avg. elevation: 1,418ft
If I climbed the "average" amount some have claimed here, combined with the miles I log, I would do over 1 million vertical feet a year. People seem to ignore the descent that invariably follows the climb when giving their "averages." My climb to the Forest Falls campground yesterday logged 4,600ft in 20.6 miles-- so I guess my BF-standard climbing average is 223ft/mi.
08-02-16 | 02:39 PM
#49
pluralis majestatis
Joined: Feb 2004
Posts: 4,206
Likes: 5
From: you rope
Bikes: a DuhRosa
mean and median ride almost exactly 60km/600hm = 53ft/mile
including zwift rides bumps up to 55ft/mile
08-08-16 | 09:35 AM
#50
Senior Member
Joined: Jul 2016
Posts: 105
Likes: 13
From: Reno, NV
Bikes: 2020 Specialized Roubaix Comp, 2019 Specialized Diverge Sport, 2018 Santa Cruz Bronson S Aluminum 27.5, 2014 Wabi Classic (Fixed)
3 ft. per mile on my standard training route. https://www.strava.com/activities/661057388